Bank of America 2008 Annual Report Download - page 86
Download and view the complete annual report
Please find page 86 of the 2008 Bank of America annual report below. You can navigate through the pages in the report by either clicking on the pages listed below, or by using the keyword search tool below to find specific information within the annual report.-
 1
1 -
2
-
3
-
4
-
5
-
6
-
7
-
8
-
9
-
10
-
11
-
12
-
13
-
14
-
15
-
16
-
17
-
18
-
19
-
20
-
21
-
22
-
23
-
24
-
25
-
26
-
27
-
28
-
29
-
30
-
31
-
32
-
33
-
34
-
35
-
36
-
37
-
38
-
39
-
40
-
41
-
42
-
43
-
44
-
45
-
46
-
47
-
48
-
49
-
50
-
51
-
52
-
53
-
54
-
55
-
56
-
57
-
58
-
59
-
60
-
61
-
62
-
63
-
64
-
65
-
66
-
67
-
68
-
69
-
70
-
71
-
72
-
73
-
74
-
75
-
 76
76 -
 77
77 -
 78
78 -
 79
79 -
 80
80 -
 81
81 -
 82
82 -
 83
83 -
 84
84 -
 85
85 -
 86
86 -
 87
87 -
 88
88 -
 89
89 -
 90
90 -
 91
91 -
 92
92 -
 93
93 -
 94
94 -
 95
95 -
 96
96 -
97
-
98
-
99
-
100
-
101
-
102
-
103
-
104
-
105
-
106
-
107
-
108
-
109
-
110
-
111
-
112
-
113
-
114
-
115
-
116
-
117
-
118
-
119
-
120
-
121
-
122
-
123
-
124
-
125
-
126
-
127
-
128
-
129
-
130
-
131
-
132
-
133
-
134
-
135
-
136
-
137
-
138
-
139
-
140
-
141
-
142
-
143
-
144
-
145
-
146
-
147
-
148
-
149
-
150
-
151
-
152
-
153
-
154
-
155
-
156
-
157
-
158
-
159
-
160
-
161
-
162
-
163
-
164
-
165
-
166
-
167
-
168
-
169
-
170
-
171
-
172
-
173
-
174
-
175
-
176
-
177
-
178
-
179
-
180
-
181
-
182
-
183
-
184
-
185
-
186
-
187
-
188
-
189
-
190
-
191
-
192
-
193
-
194
-
195
 |
 |

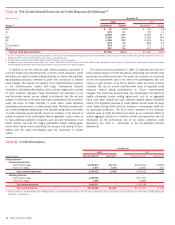
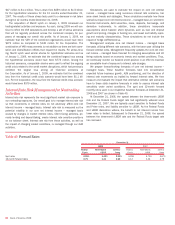
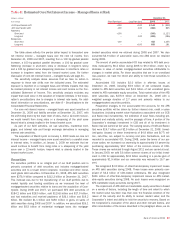
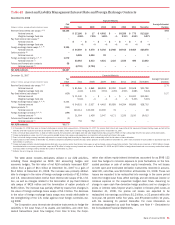
For reporting purposes, we allocate the allowance for credit losses across products. However, the allowance is available to absorb any credit losses
without restriction. Table 38 presents our allocation by product type.
Table 38 Allocation of the Allowance for Credit Losses by Product Type (1)
December 31
2008 2007
(Dollars in millions) Amount
Percent
of Total
Percent of
Loans and
Leases
Outstanding
(2)
Amount
Percent
of Total
Percent of
Loans and
Leases
Outstanding
(2)
Allowance for loan and lease losses
Residential mortgage
(3)
$ 1,382 5.99% 0.56%
$ 207 1.79% 0.08%
Home equity
5,385 23.34 3.53
963 8.31 0.84
Discontinued real estate
658 2.85 3.29
n/a n/a n/a
Credit card – domestic
3,947 17.11 6.16
2,919 25.19 4.44
Credit card – foreign
742 3.22 4.33
441 3.81 2.95
Direct/Indirect consumer
4,341 18.81 5.20
2,077 17.92 2.71
Other consumer
203 0.88 5.87
151 1.30 3.61
Total consumer
16,658 72.20 2.83
6,758 58.32 1.23
Commercial – domestic
(4)
4,339 18.81 1.98
3,194 27.56 1.53
Commercial real estate
1,465 6.35 2.26
1,083 9.35 1.77
Commercial lease financing
223 0.97 1.00
218 1.88 0.97
Commercial – foreign
386 1.67 1.25
335 2.89 1.18
Total commercial
(5)
6,413 27.80 1.90
4,830 41.68 1.51
Allowance for loan and lease losses
23,071 100.00% 2.49%
11,588 100.00% 1.33%
Reserve for unfunded lending commitments
421
518
Allowance for credit losses
$23,492
$12,106
(1) We account for acquired impaired loans in accordance with SOP 03-3. For more information on the impact of SOP 03-3 on asset quality, see Consumer Portfolio Credit Risk beginning on page 62.
(2) Ratios are calculated as allowance for loan and lease losses as a percentage of loans and leases outstanding excluding loans measured in accordance with SFAS 159 for each loan and lease category. Loans
measured at fair value include commercial – domestic loans of $3.5 billion and $3.5 billion, commercial-foreign loans of $1.7 billion and $790 million, and commercial real estate loans of $203 million and $304
million at December 31, 2008 and 2007.
(3) Allowance for loan and leases losses at December 31, 2008 includes the benefit of amounts expected to be reimbursable under cash collateralized synthetic securitizations. Excluding these benefits the allowance to
ending loans would be 0.69 percent. See Residential Mortgage beginning on page 63 for more information.
(4) Includes allowance for small business commercial – domestic loans of $2.4 billion and $1.4 billion at December 31, 2008 and 2007.
(5) Includes allowance for loan and lease losses for impaired commercial loans of $691 million and $123 million at December 31, 2008 and 2007.
n/a = not applicable
Market Risk Management
Market risk is the risk that values of assets and liabilities or revenues will
be adversely affected by changes in market conditions such as market
movements. This risk is inherent in the financial instruments associated
with our operations and/or activities including loans, deposits, securities,
short-term borrowings, long-term debt, trading account assets and
liabilities, and derivatives. Market-sensitive assets and liabilities are
generated through loans and deposits associated with our traditional
banking business, customer and proprietary trading operations, ALM
process, credit risk mitigation activities and mortgage banking activities.
In the event of market volatility, factors such as underlying market move-
ments and liquidity have an impact on the results of the Corporation.
Our traditional banking loan and deposit products are nontrading posi-
tions and are reported at amortized cost for assets or the amount owed
for liabilities (historical cost). GAAP requires a historical cost view of tradi-
tional banking assets and liabilities. However, these positions are still
subject to changes in economic value based on varying market con-
ditions, primarily changes in the levels of interest rates. The risk of
adverse changes in the economic value of our nontrading positions is
managed through our ALM activities. We have elected to fair value certain
loan and deposit products in accordance with SFAS 159. For further
information on fair value of certain financial assets and liabilities, see
Note 19 – Fair Value Disclosures to the Consolidated Financial State-
ments.
Our trading positions are reported at fair value with changes currently
reflected in income. Trading positions are subject to various risk factors,
which include exposures to interest rates and foreign exchange rates, as
well as mortgage, equity, commodity, issuer and market liquidity risk
factors. We seek to mitigate these risk exposures by using techniques
that encompass a variety of financial instruments in both the cash and
derivatives markets. The following discusses the key risk components
along with respective risk mitigation techniques.
Interest Rate Risk
Interest rate risk represents exposures to instruments whose values vary
with the level or volatility of interest rates. These instruments include, but
are not limited to, loans, debt securities, certain trading-related assets
and liabilities, deposits, borrowings and derivative instruments. Hedging
instruments used to mitigate these risks include related derivatives such
as options, futures, forwards and swaps.
Foreign Exchange Risk
Foreign exchange risk represents exposures to changes in the values of
current holdings and future cash flows denominated in other currencies.
The types of instruments exposed to this risk include investments in for-
eign subsidiaries, foreign currency-denominated loans and securities,
future cash flows in foreign currencies arising from foreign exchange
transactions, foreign currency-denominated debt and various foreign
exchange derivative instruments whose values fluctuate with changes in
the level or volatility of currency exchange rates or foreign interest rates.
Hedging instruments used to mitigate this risk include foreign exchange
options, currency swaps, futures, forwards, foreign currency denominated
debt and deposits.
84
Bank of America 2008