Bank of America 2008 Annual Report Download - page 186
Download and view the complete annual report
Please find page 186 of the 2008 Bank of America annual report below. You can navigate through the pages in the report by either clicking on the pages listed below, or by using the keyword search tool below to find specific information within the annual report.-
 1
1 -
2
-
3
-
4
-
5
-
6
-
7
-
8
-
9
-
10
-
11
-
12
-
13
-
14
-
15
-
16
-
17
-
18
-
19
-
20
-
21
-
22
-
23
-
24
-
25
-
26
-
27
-
28
-
29
-
30
-
31
-
32
-
33
-
34
-
35
-
36
-
37
-
38
-
39
-
40
-
41
-
42
-
43
-
44
-
45
-
46
-
47
-
48
-
49
-
50
-
51
-
52
-
53
-
54
-
55
-
56
-
57
-
58
-
59
-
60
-
61
-
62
-
63
-
64
-
65
-
66
-
67
-
68
-
69
-
70
-
71
-
72
-
73
-
74
-
75
-
76
-
77
-
78
-
79
-
80
-
81
-
82
-
83
-
84
-
85
-
86
-
87
-
88
-
89
-
90
-
91
-
92
-
93
-
94
-
95
-
96
-
97
-
98
-
99
-
100
-
101
-
102
-
103
-
104
-
105
-
106
-
107
-
108
-
109
-
110
-
111
-
112
-
113
-
114
-
115
-
116
-
117
-
118
-
119
-
120
-
121
-
122
-
123
-
124
-
125
-
126
-
127
-
128
-
129
-
130
-
131
-
132
-
133
-
134
-
135
-
136
-
137
-
138
-
139
-
140
-
141
-
142
-
143
-
144
-
145
-
146
-
147
-
148
-
149
-
150
-
151
-
152
-
153
-
154
-
155
-
156
-
157
-
158
-
159
-
160
-
161
-
162
-
163
-
164
-
165
-
166
-
167
-
168
-
169
-
170
-
171
-
172
-
173
-
174
-
175
-
 176
176 -
 177
177 -
 178
178 -
 179
179 -
 180
180 -
 181
181 -
 182
182 -
 183
183 -
 184
184 -
 185
185 -
 186
186 -
 187
187 -
 188
188 -
 189
189 -
 190
190 -
 191
191 -
 192
192 -
 193
193 -
 194
194 -
 195
195
 |
 |

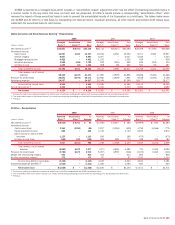
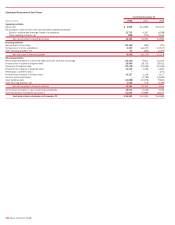
The following table presents total revenue, net of interest expense, on a FTE basis and net income for 2008, 2007, and 2006, and total assets at
December 31, 2008 and 2007 for each business segment, as well as All Other.
Business Segments
At and for the Year Ended December 31 Total Corporation
(1)
Global Consumer and
Small Business Banking
(2, 3)
(Dollars in millions) 2008 2007 2006 2008 2007 2006
Net interest income
(4)
$ 46,554
$ 36,190 $35,818 $ 33,851 $ 28,712 $28,059
Noninterest income
27,422
32,392 38,182 24,493 19,143 16,769
Total revenue, net of interest expense
73,976
68,582 74,000 58,344 47,855 44,828
Provision for credit losses
(5)
26,825
8,385 5,010 26,841 12,920 8,518
Amortization of intangibles
1,834
1,676 1,755 1,383 1,336 1,452
Other noninterest expense
39,695
35,848 34,038 23,554 19,013 16,725
Income before income taxes
5,622
22,673 33,197 6,566 14,586 18,133
Income tax expense
(4)
1,614
7,691 12,064 2,332 5,224 6,682
Net income
$ 4,008
$ 14,982 $21,133 $ 4,234 $ 9,362 $11,451
Period-end total assets
$1,817,943
$1,715,746 $511,401 $445,319
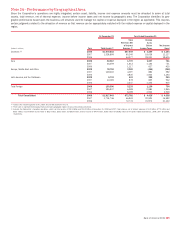
Global Corporate
and Investment Banking
(2)
Global Wealth and
Investment Management
(2)
(Dollars in millions) 2008 2007 2006 2008 2007 2006
Net interest income
(4)
$ 16,538
$ 11,206 $ 9,914 $ 4,775 $ 3,917 $ 3,754
Noninterest income (loss)
(3,098)
2,445 11,443 3,010 3,636 3,330
Total revenue, net of interest expense
13,440
13,651 21,357 7,785 7,553 7,084
Provision for credit losses
(5)
3,080
658 6 664 14 (39)
Amortization of intangibles
191
178 218 231 150 72
Other noninterest expense
10,190
12,020 11,659 4,673 4,330 3,652
Income (loss) before income taxes
(21)
795 9,474 2,217 3,059 3,399
Income tax expense (benefit)
(4)
(7)
285 3,505 801 1,099 1,257
Net income (loss)
$ (14)
$ 510 $ 5,969 $ 1,416 $ 1,960 $ 2,142
Period-end total assets
$ 707,170
$ 778,158 $187,994 $155,683
All Other
(2, 3)
(Dollars in millions) 2008 2007 2006
Net interest income
(4)
$ (8,610)
$ (7,645) $ (5,909)
Noninterest income
3,017
7,168 6,640
Total revenue, net of interest expense
(5,593)
(477) 731
Provision for credit losses
(5)
(3,760)
(5,207) (3,475)
Amortization of intangibles
29
12 13
Other noninterest expense
1,278
485 2,002
Income (loss) before income taxes
(3,140)
4,233 2,191
Income tax expense (benefit)
(4)
(1,512)
1,083 620
Net income (loss)
$ (1,628)
$ 3,150 $ 1,571
Period-end total assets
$ 411,378
$ 336,586
(1) There were no material intersegment revenues.
(2) Total assets include asset allocations to match liabilities (i.e., deposits).
(3) GCSBB is presented on a managed basis with a corresponding offset recorded in All Other.
(4) FTE basis
(5) Provision for credit losses represents: For GCSBB – Provision for credit losses on held loans combined with realized credit losses associated with the securitized loan portfolio and for All Other – Provision for credit
losses combined with the GCSBB securitization offset.
184
Bank of America 2008