Bank of America 2008 Annual Report Download - page 180
Download and view the complete annual report
Please find page 180 of the 2008 Bank of America annual report below. You can navigate through the pages in the report by either clicking on the pages listed below, or by using the keyword search tool below to find specific information within the annual report.-
 1
1 -
2
-
3
-
4
-
5
-
6
-
7
-
8
-
9
-
10
-
11
-
12
-
13
-
14
-
15
-
16
-
17
-
18
-
19
-
20
-
21
-
22
-
23
-
24
-
25
-
26
-
27
-
28
-
29
-
30
-
31
-
32
-
33
-
34
-
35
-
36
-
37
-
38
-
39
-
40
-
41
-
42
-
43
-
44
-
45
-
46
-
47
-
48
-
49
-
50
-
51
-
52
-
53
-
54
-
55
-
56
-
57
-
58
-
59
-
60
-
61
-
62
-
63
-
64
-
65
-
66
-
67
-
68
-
69
-
70
-
71
-
72
-
73
-
74
-
75
-
76
-
77
-
78
-
79
-
80
-
81
-
82
-
83
-
84
-
85
-
86
-
87
-
88
-
89
-
90
-
91
-
92
-
93
-
94
-
95
-
96
-
97
-
98
-
99
-
100
-
101
-
102
-
103
-
104
-
105
-
106
-
107
-
108
-
109
-
110
-
111
-
112
-
113
-
114
-
115
-
116
-
117
-
118
-
119
-
120
-
121
-
122
-
123
-
124
-
125
-
126
-
127
-
128
-
129
-
130
-
131
-
132
-
133
-
134
-
135
-
136
-
137
-
138
-
139
-
140
-
141
-
142
-
143
-
144
-
145
-
146
-
147
-
148
-
149
-
150
-
151
-
152
-
153
-
154
-
155
-
156
-
157
-
158
-
159
-
160
-
161
-
162
-
163
-
164
-
165
-
166
-
167
-
168
-
169
-
 170
170 -
 171
171 -
 172
172 -
 173
173 -
 174
174 -
 175
175 -
 176
176 -
 177
177 -
 178
178 -
 179
179 -
 180
180 -
 181
181 -
 182
182 -
 183
183 -
 184
184 -
 185
185 -
 186
186 -
 187
187 -
 188
188 -
 189
189 -
 190
190 -
191
-
192
-
193
-
194
-
195
 |
 |

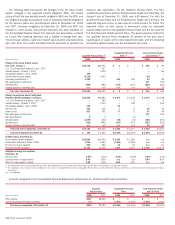
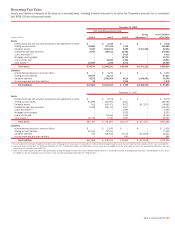
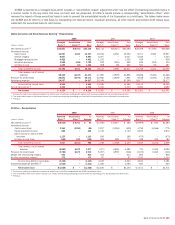
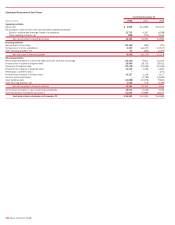
The table below presents a reconciliation of all assets and liabilities measured at fair value on a recurring basis using significant unobservable
inputs (Level 3) during the year ended December 31, 2008 and 2007, including realized and unrealized gains (losses) included in earnings and OCI.
Level 3 Fair Value Measurements
Year Ended December 31, 2008
(Dollars in millions)
Net
Derivatives
(1)
Trading
Account
Assets
Available-for-
Sale Debt
Securities
Loans and
Leases
(2)
Mortgage
Servicing
Rights
Loans
Held-for-
Sale
(2)
Other
Assets
(3)
Accrued
Expenses
and Other
Liabilities
(2)
Balance, January 1, 2008
$(1,203)
$ 4,027 $ 5,507 $ 4,590 $ 3,053 $ 1,334 $ 3,987 $ (660)
Countrywide acquisition
(185)
1,407 528 – 17,188 1,425 – (1,212)
Included in earnings
2,531
(3,222) (2,509) (780) (7,115) (1,047) 175 (169)
Included in other comprehensive income
–
– (1,688) – – – – –
Purchases, issuances and settlements
1,380
(2,055) 2,754 1,603 (393) (542) (550) 101
Transfers into (out of) Level 3
(253)
7,161 14,110 – – 2,212 (40) –
Balance, December 31, 2008
$ 2,270
$ 7,318 $18,702 $ 5,413 $12,733 $ 3,382 $ 3,572 $(1,940)
Year Ended December 31, 2007
Balance, January 1, 2007 $ 788 $ 303 $ 1,133 $3,947 $ 2,869 $ – $6,605 $ (349)
Included in earnings (341) (2,959) (398) (140) 231 (90) 2,149 (279)
Included in other comprehensive income – – (206) – – – (79) –
Purchases, issuances and settlements (333) 708 4,588 783 (47) (1,259) (4,638) (32)
Transfers into (out of) Level 3 (1,317) 5,975 390 – – 2,683 (50) –
Balance, December 31, 2007 $(1,203) $ 4,027 $ 5,507 $4,590 $ 3,053 $ 1,334 $3,987 $ (660)
(1) Net derivatives at December 31, 2008 and 2007 included derivative assets of $8.3 billion and $9.0 billion and derivative liabilities of $6.0 billion and $10.2 billion. Net derivatives acquired in connection with
Countrywide on July 1, 2008 included derivative assets of $107 million and derivative liabilities of $292 million.
(2) Amounts represent items which are accounted for at fair value in accordance with SFAS 159 including commercial loan commitments and certain secured financings recorded in accrued expenses and other liabilities.
(3) Other assets include equity investments held by Principal Investing and certain retained interests in securitization vehicles, including interest-only strips.
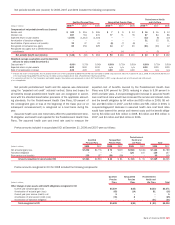
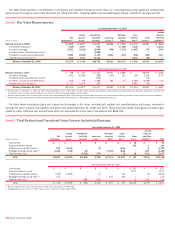
The table below summarizes gains and losses due to changes in fair value, including both realized and unrealized gains and losses, recorded in
earnings for Level 3 assets and liabilities during the year ended December 31, 2008 and 2007. These amounts include those gains and losses gen-
erated by loans, LHFS and loan commitments which are accounted for at fair value in accordance with SFAS 159.
Level 3 Total Realized and Unrealized Gains (Losses) Included in Earnings
Year Ended December 31, 2008
(Dollars in millions)
Net
Derivatives
Trading
Account
Assets
Available-for-
Sale Debt
Securities
Loans and
Leases
(1)
Mortgage
Servicing
Rights
Loans
Held-for-
Sale
(1)
Other
Assets
Accrued
Expenses
and Other
Liabilities
(1)
Total
Card income
$–
$ – $– $– $–$–$55 $– $55
Equity investment income
–
– – – – – 110 – 110
Trading account profits (losses)
103
(3,044) – (5) – (195) – 9 (3,132)
Mortgage banking income (loss)
(2)
2,428
(178) (74) – (7,115) (848) – 295 (5,492)
Other income (loss)
–
– (2,435) (775) – (4) 10 (473) (3,677)
Total
$2,531
$ (3,222) $(2,509) $(780) $(7,115) $(1,047) $ 175 $(169) $(12,136)
Year Ended December 31, 2007
Card income
$–
$– $– $– $–$–$103 $– $103
Equity investment income
–
– – – – – 1,971 – 1,971
Trading account profits (losses)
(515)
(2,959) – (1) – (61) – (5) (3,541)
Mortgage banking income (loss)
(2)
174
– – – 231 (29) – – 376
Other income (loss)
–
– (398) (139) – – 75 (274) (736)
Total
$ (341)
$(2,959) $ (398) $(140) $ 231 $ (90) $2,149 $(279) $ (1,827)
(1) Amounts represent items which are accounted for at fair value in accordance with SFAS 159.
(2) Mortgage banking income does not reflect impact of Level 1 and Level 2 hedges against MSRs.
178
Bank of America 2008