Bank of America 2008 Annual Report Download - page 37
Download and view the complete annual report
Please find page 37 of the 2008 Bank of America annual report below. You can navigate through the pages in the report by either clicking on the pages listed below, or by using the keyword search tool below to find specific information within the annual report.-
 1
1 -
2
-
3
-
4
-
5
-
6
-
7
-
8
-
9
-
10
-
11
-
12
-
13
-
14
-
15
-
16
-
17
-
18
-
19
-
20
-
21
-
22
-
23
-
24
-
25
-
26
-
 27
27 -
 28
28 -
 29
29 -
 30
30 -
 31
31 -
 32
32 -
 33
33 -
 34
34 -
 35
35 -
 36
36 -
 37
37 -
 38
38 -
 39
39 -
 40
40 -
 41
41 -
 42
42 -
 43
43 -
 44
44 -
 45
45 -
 46
46 -
 47
47 -
48
-
49
-
50
-
51
-
52
-
53
-
54
-
55
-
56
-
57
-
58
-
59
-
60
-
61
-
62
-
63
-
64
-
65
-
66
-
67
-
68
-
69
-
70
-
71
-
72
-
73
-
74
-
75
-
76
-
77
-
78
-
79
-
80
-
81
-
82
-
83
-
84
-
85
-
86
-
87
-
88
-
89
-
90
-
91
-
92
-
93
-
94
-
95
-
96
-
97
-
98
-
99
-
100
-
101
-
102
-
103
-
104
-
105
-
106
-
107
-
108
-
109
-
110
-
111
-
112
-
113
-
114
-
115
-
116
-
117
-
118
-
119
-
120
-
121
-
122
-
123
-
124
-
125
-
126
-
127
-
128
-
129
-
130
-
131
-
132
-
133
-
134
-
135
-
136
-
137
-
138
-
139
-
140
-
141
-
142
-
143
-
144
-
145
-
146
-
147
-
148
-
149
-
150
-
151
-
152
-
153
-
154
-
155
-
156
-
157
-
158
-
159
-
160
-
161
-
162
-
163
-
164
-
165
-
166
-
167
-
168
-
169
-
170
-
171
-
172
-
173
-
174
-
175
-
176
-
177
-
178
-
179
-
180
-
181
-
182
-
183
-
184
-
185
-
186
-
187
-
188
-
189
-
190
-
191
-
192
-
193
-
194
-
195
 |
 |

Card Services
Card Services, which excludes the results of Debit Card (included in
Deposits and Student Lending), provides a broad offering of products,
including U.S. Consumer and Business Card, Unsecured Lending, and
International Card. We offer a variety of co-branded and affinity credit card
products and are one of the leading issuers of credit cards through
endorsed marketing in the U.S. and Europe.
The Corporation reports its Card Services results on a managed basis,
which is consistent with the way that management evaluates the results
of Card Services. Managed basis assumes that securitized loans were
not sold and presents earnings on these loans in a manner similar to the
way loans that have not been sold (i.e., held loans) are presented. Loan
securitization is an alternative funding process that is used by the Corpo-
ration to diversify funding sources. Loan securitization removes loans
from the Consolidated Balance Sheet through the sale of loans to an
off-balance sheet QSPE which is excluded from the Corporation’s Con-
solidated Financial Statements in accordance with GAAP.
Securitized loans continue to be serviced by the business and are
subject to the same underwriting standards and ongoing monitoring as
held loans. In addition, excess servicing income is exposed to similar
credit risk and repricing of interest rates as held loans. The financial
market disruptions that began in 2007 continued to impact the economy
and financial services sector. Late in the third quarter and into the fourth
quarter of 2008, liquidity for asset-backed securities disappeared and
spreads rose to historic highs, negatively impacting our credit card securi-
tization programs. If these conditions persist, it could adversely affect our
ability to access these markets at favorable terms. For more information,
see the Liquidity Risk and Capital Management discussion on page 55.
Net income decreased $3.1 billion, or 85 percent, to $521 million
compared to 2007 as growth in net interest income and noninterest
income was more than offset by higher provision for credit losses of $8.2
billion.
Net interest income grew $2.9 billion, or 18 percent, to $19.2 billion
driven by higher managed average loans and leases of $21.3 billion, or
10 percent, combined with the beneficial impact of the decrease in short-
term interest rates on our funding costs.
Noninterest income increased $218 million, or two percent, to $9.2
billion as other income benefited from the $388 million gain related to
Card Services’ allocation of the Visa IPO as well as a $283 million gain
on the sale of a card portfolio. These increases were partially offset by
the decrease in card income of $377 million, or five percent, due to the
unfavorable change in the value of the interest-only strip and decreases in
interchange income driven by reduced retail volume and late fees.
Provision for credit losses increased $8.2 billion, or 73 percent, to
$19.6 billion compared to 2007 primarily driven by portfolio deterioration
and higher bankruptcies from impacts of the slowing economy, a lower
level of foreign securitizations and growth-related seasoning of the portfo-
lio. For further discussion, see Provision for Credit Losses on page 81.
Noninterest expense decreased $238 million, or three percent, to
$8.1 billion compared to 2007, as the impact of certain benefits asso-
ciated with the Visa IPO transactions and lower marketing expense were
partially offset by higher personnel and technology-related expenses from
increased customer assistance and collections infrastructure.
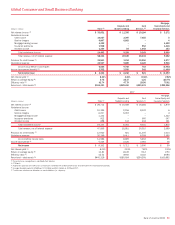
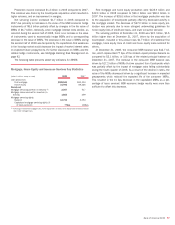
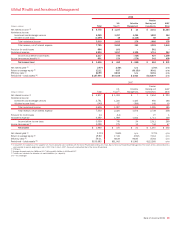
Key Statistics
(Dollars in millions) 2008 2007
Card Services
Average – total loans and leases:
Managed
$229,347
$208,094
Held
124,946
104,810
Period end – total loans and leases:
Managed
226,081
225,889
Held
125,121
122,922
Managed net losses
(1)
:
Amount
15,321
10,088
Percent
(3)
6.68%
4.85%
Credit Card (2)
Average – total loans and leases:
Managed
$184,246
$171,376
Held
79,845
70,242
Period end – total loans and leases:
Managed
182,234
183,691
Held
81,274
80,724
Managed net losses
(1)
:
Amount
11,382
8,214
Percent
(3)
6.18%
4.79%
(1) Represents net charge-offs on held loans combined with realized credit losses associated with the
securitized loan portfolio.
(2) Includes U.S. consumer, foreign and U.S. government card. Does not include business card and
unsecured lending.
(3) Ratios are calculated as managed net losses divided by average outstanding managed loans and leases
during the year.
The table above and the following discussion presents select key
indicators for the Card Services and credit card portfolios.
Managed Card Services net losses increased $5.2 billion to $15.3
billion, or 6.68 percent of average outstandings, compared to $10.1 bil-
lion, or 4.85 percent in 2007. This increase was driven by portfolio
deterioration and higher bankruptcies reflecting the impacts of the slow-
ing economy. Additionally, portfolio deterioration during the second half of
2008 and growth-related seasoning of the unsecured lending portfolio
drove a portion of the increase.
Managed credit card net losses increased $3.2 billion to $11.4 bil-
lion, or 6.18 percent of average credit card outstandings, compared to
$8.2 billion, or 4.79 percent in 2007. The increase was driven by portfo-
lio deterioration and higher bankruptcies reflecting the impacts of a slow-
ing economy.
For more information on credit quality, see Consumer Portfolio Credit
Risk Management beginning on page 62.
Bank of America 2008
35