Bank of America 2008 Annual Report Download - page 41
Download and view the complete annual report
Please find page 41 of the 2008 Bank of America annual report below. You can navigate through the pages in the report by either clicking on the pages listed below, or by using the keyword search tool below to find specific information within the annual report.-
 1
1 -
2
-
3
-
4
-
5
-
6
-
7
-
8
-
9
-
10
-
11
-
12
-
13
-
14
-
15
-
16
-
17
-
18
-
19
-
20
-
21
-
22
-
23
-
24
-
25
-
26
-
27
-
28
-
29
-
30
-
 31
31 -
 32
32 -
 33
33 -
 34
34 -
 35
35 -
 36
36 -
 37
37 -
 38
38 -
 39
39 -
 40
40 -
 41
41 -
 42
42 -
 43
43 -
 44
44 -
 45
45 -
 46
46 -
 47
47 -
 48
48 -
 49
49 -
 50
50 -
 51
51 -
52
-
53
-
54
-
55
-
56
-
57
-
58
-
59
-
60
-
61
-
62
-
63
-
64
-
65
-
66
-
67
-
68
-
69
-
70
-
71
-
72
-
73
-
74
-
75
-
76
-
77
-
78
-
79
-
80
-
81
-
82
-
83
-
84
-
85
-
86
-
87
-
88
-
89
-
90
-
91
-
92
-
93
-
94
-
95
-
96
-
97
-
98
-
99
-
100
-
101
-
102
-
103
-
104
-
105
-
106
-
107
-
108
-
109
-
110
-
111
-
112
-
113
-
114
-
115
-
116
-
117
-
118
-
119
-
120
-
121
-
122
-
123
-
124
-
125
-
126
-
127
-
128
-
129
-
130
-
131
-
132
-
133
-
134
-
135
-
136
-
137
-
138
-
139
-
140
-
141
-
142
-
143
-
144
-
145
-
146
-
147
-
148
-
149
-
150
-
151
-
152
-
153
-
154
-
155
-
156
-
157
-
158
-
159
-
160
-
161
-
162
-
163
-
164
-
165
-
166
-
167
-
168
-
169
-
170
-
171
-
172
-
173
-
174
-
175
-
176
-
177
-
178
-
179
-
180
-
181
-
182
-
183
-
184
-
185
-
186
-
187
-
188
-
189
-
190
-
191
-
192
-
193
-
194
-
195
 |
 |

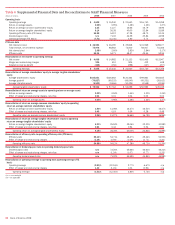
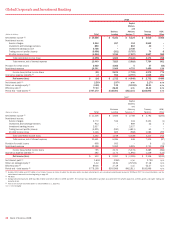
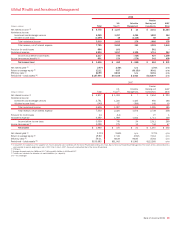
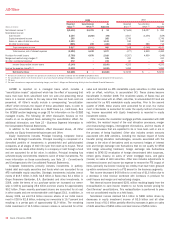
December 31 Average Balance
(Dollars in millions) 2008 2007 2008 2007
Total loans and leases
$340,692
$326,042 $337,352 $274,725
Total trading-related assets
247,552
308,316 341,544 362,195
Total market-based earning assets
(1)
244,914
360,276 368,751 412,587
Total earning assets
(2)
589,431
675,407 699,708 677,215
Total assets
(2)
707,170
778,158 816,832 771,219
Total deposits
251,798
246,242 239,097 219,891
(1) Total market-based earning assets represents earning assets included in CMAS but excludes loans that are accounted for at fair value in accordance with SFAS 159.
(2) Total earning assets and total assets include asset allocations to match liabilities (i.e., deposits).
GCIB provides a wide range of financial services to both our issuer
and investor clients that range from business banking clients to large
international corporate and institutional investor clients using a strategy
to deliver value-added financial products, transaction and advisory serv-
ices. GCIB’s products and services are delivered from three primary busi-
nesses: Business Lending, CMAS, and Treasury Services, and are
provided to our clients through a global team of client relationship
managers and product partners. In addition, ALM/Other includes the
results of ALM activities and other GCIB activities. Our clients are sup-
ported through offices in 22 countries that are divided into four distinct
geographic regions: U.S. and Canada; Asia; Europe, Middle East, and
Africa; and Latin America. For more information on our foreign operations,
see Foreign Portfolio beginning on page 79.
On January 1, 2009, we acquired Merrill Lynch in exchange for com-
mon and preferred stock with a value of $29.1 billion, creating a premier
financial services franchise with significantly enhanced wealth manage-
ment, investment banking and international capabilities. In addition, the
acquisition adds strengths in debt and equity underwriting, sales and
trading, and global merger and acquisition advice, creating significant
opportunities to deepen relationships with corporate and institutional
clients around the globe. For more information related to the Merrill Lynch
acquisition, see Note 2 – Merger and Restructuring Activity to the Con-
solidated Financial Statements.
During 2008, we reached an agreement with the Massachusetts
Securities Division under which we offered to purchase at par ARS held by
our retail customers, including individual investors, businesses, and
charitable organizations. Further in October 2008, we announced other
agreements in principle with the SEC, the Office of the NYAG, and the
North American Securities Administrators Association. These agreements
are substantially similar except that the agreement with the NYAG
requires the payment of a penalty. These agreements will cover approx-
imately $5.3 billion in ARS held by an estimated 5,600 of our customers.
We purchased approximately $4.7 billion of securities, $2.7 billion of
which were purchased by GWIM and $2.0 billion of which were purchased
by GCIB. During the year, we recognized mark-to-market losses of $181
million and $312 million in GWIM and GCIB on these securities and a
penalty of $50 million which was equally allocated to GWIM and GCIB.As
of December 31, 2008, our remaining commitment to purchase ARS was
$675 million of which $537 million related to GWIM and $138 million
related to GCIB.
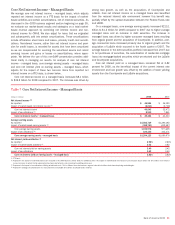
Net income decreased $524 million to a net loss of $14 million and
total revenue decreased $211 million, or two percent, to $13.4 billion in
2008 compared to 2007. These decreases were driven by losses result-
ing from our CDO and other trading exposures. Additionally, we experi-
enced an increase in provision for credit losses which was partially offset
by higher net interest income and a decrease in noninterest expense.
Net interest income increased $5.3 billion, or 48 percent, driven
primarily by higher market-based net interest income which benefited from
the steepening of the yield curve and product mix. Additionally, net inter-
est income benefited from growth in average loans and leases of $62.6
billion, or 23 percent, combined with a higher margin on ALM activities.
These benefits were partially offset by the impact of competitive deposit
pricing and a shift in the deposit product mix as more customers moved
their deposits to higher yielding products. The growth in average loans
and deposits was due to the LaSalle merger as well as organic growth.
Noninterest income decreased $5.5 billion to a loss of $3.1 billion in
2008 compared to 2007, driven by declines in trading account profits
(losses) of $1.0 billion and other income of $5.2 billion. For more
information on the aforementioned decreases, see the CMAS discussion.
Additionally, noninterest income benefited from the favorable impact of
the Visa IPO transactions and an increase in service charge income.
The provision for credit losses increased $2.4 billion to $3.1 billion in
2008 compared to 2007 reflecting higher credit costs in Business Lend-
ing. For further information, see the Business Lending discussion.
Noninterest expense decreased $1.8 billion, or 15 percent, mainly
due to a reduction in performance-based incentive compensation in CMAS
and the impact of certain benefits associated with the Visa IPO trans-
actions, partially offset by the addition of LaSalle.
Business Lending
Business Lending provides a wide range of lending-related products and
services to our clients through client relationship teams along with vari-
ous product partners. Products include commercial and corporate bank
loans and commitment facilities which cover our business banking cli-
ents, middle-market commercial clients and our large multinational corpo-
rate clients. Real estate lending products are issued primarily to public
and private developers, homebuilders and commercial real estate firms.
Leasing and asset-based lending products offer our clients innovative
financing products. Products also include indirect consumer loans which
allow us to offer financing through automotive, marine, motorcycle and
recreational vehicle dealerships across the U.S. Business Lending also
contains the results for the economic hedging of our risk to certain
middle-market and real estate-related commercial credit counterparties
utilizing various risk mitigation tools.
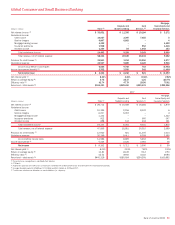
Net income decreased $278 million, or 14 percent, to $1.7 billion in
2008 compared to 2007 as increases in net interest income and non-
interest income combined with a decrease in noninterest expense were
more than offset by increases in provision for credit losses.
Net interest income increased $1.3 billion, or 26 percent, driven by
average loan growth of 25 percent to $311.0 billion. The increase in
average loans and leases was attributable to the LaSalle acquisition and
organic growth primarily in commercial – domestic and real estate loans.
The increase in noninterest income of $443 million, or 38 percent,
was mainly driven by improved economic hedging results of our exposures
to certain commercial clients and an increase in service charges.
The provision for credit losses increased $2.4 billion to $3.1 billion in
2008 compared to 2007, reflecting reserve increases and higher charge-
offs primarily due to the continued weakness in the housing markets on
the homebuilder portfolio. Also contributing to this increase were higher
commercial – domestic and foreign net charge-offs which increased from
Bank of America 2008
39