Bank of America 2008 Annual Report Download - page 111
Download and view the complete annual report
Please find page 111 of the 2008 Bank of America annual report below. You can navigate through the pages in the report by either clicking on the pages listed below, or by using the keyword search tool below to find specific information within the annual report.-
 1
1 -
2
-
3
-
4
-
5
-
6
-
7
-
8
-
9
-
10
-
11
-
12
-
13
-
14
-
15
-
16
-
17
-
18
-
19
-
20
-
21
-
22
-
23
-
24
-
25
-
26
-
27
-
28
-
29
-
30
-
31
-
32
-
33
-
34
-
35
-
36
-
37
-
38
-
39
-
40
-
41
-
42
-
43
-
44
-
45
-
46
-
47
-
48
-
49
-
50
-
51
-
52
-
53
-
54
-
55
-
56
-
57
-
58
-
59
-
60
-
61
-
62
-
63
-
64
-
65
-
66
-
67
-
68
-
69
-
70
-
71
-
72
-
73
-
74
-
75
-
76
-
77
-
78
-
79
-
80
-
81
-
82
-
83
-
84
-
85
-
86
-
87
-
88
-
89
-
90
-
91
-
92
-
93
-
94
-
95
-
96
-
97
-
98
-
99
-
100
-
 101
101 -
 102
102 -
 103
103 -
 104
104 -
 105
105 -
 106
106 -
 107
107 -
 108
108 -
 109
109 -
 110
110 -
 111
111 -
 112
112 -
 113
113 -
 114
114 -
 115
115 -
 116
116 -
 117
117 -
 118
118 -
 119
119 -
 120
120 -
 121
121 -
122
-
123
-
124
-
125
-
126
-
127
-
128
-
129
-
130
-
131
-
132
-
133
-
134
-
135
-
136
-
137
-
138
-
139
-
140
-
141
-
142
-
143
-
144
-
145
-
146
-
147
-
148
-
149
-
150
-
151
-
152
-
153
-
154
-
155
-
156
-
157
-
158
-
159
-
160
-
161
-
162
-
163
-
164
-
165
-
166
-
167
-
168
-
169
-
170
-
171
-
172
-
173
-
174
-
175
-
176
-
177
-
178
-
179
-
180
-
181
-
182
-
183
-
184
-
185
-
186
-
187
-
188
-
189
-
190
-
191
-
192
-
193
-
194
-
195
 |
 |

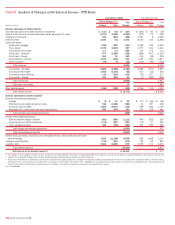
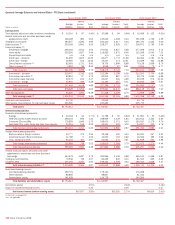
Table XIII Quarterly Average Balances and Interest Rates – FTE Basis
Fourth Quarter 2008 Third Quarter 2008
(Dollars in millions)
Average
Balance
Interest
Income/
Expense
Yield/
Rate
Average
Balance
Interest
Income/
Expense
Yield/
Rate
Earning assets
Time deposits placed and other short-term investments
$ 10,511
$ 158 5.97% $ 11,361 $ 101 3.54%
Federal funds sold and securities purchased under agreements to resell
104,843
393 1.50 136,322 912 2.67
Trading account assets
205,698
2,170 4.21 191,757 2,390 4.98
Debt securities
(1)
280,942
3,913 5.57 266,013 3,672 5.52
Loans and leases
(2)
:
Residential mortgage
253,468
3,581 5.65 260,748 3,712 5.69
Home equity
152,035
1,969 5.17 151,142 2,124 5.59
Discontinued real estate
21,324
459 8.60 22,031 399 7.25
Credit card – domestic
64,906
1,784 10.94 63,414 1,682 10.55
Credit card – foreign
17,211
521 12.05 17,075 535 12.47
Direct/Indirect consumer
(3)
83,331
1,714 8.18 85,392 1,790 8.34
Other consumer
(4)
3,544 70 7.83
3,723 80 8.78
Total consumer
595,819 10,098 6.76
603,525 10,322 6.82
Commercial – domestic
226,095
2,890 5.09 224,117 2,852 5.06
Commercial real estate
(5)
64,586
706 4.35 63,220 727 4.57
Commercial lease financing
22,069
242 4.40 22,585 53 0.93
Commercial – foreign
32,994 373 4.49
33,467 377 4.48
Total commercial
345,744 4,211 4.85
343,389 4,009 4.64
Total loans and leases
941,563 14,309 6.06
946,914 14,331 6.03
Other earning assets
73,116 959 5.22
70,099 1,068 6.07
Total earning assets (6)
1,616,673 21,902 5.40
1,622,466 22,474 5.52
Cash and cash equivalents
77,388
36,030
Other assets, less allowance for loan and lease losses
254,793
247,195
Total assets
$1,948,854
$1,905,691
Interest-bearing liabilities
Domestic interest-bearing deposits:
Savings
$ 31,561 $ 58 0.73%
$ 32,297 $ 58 0.72%
NOW and money market deposit accounts
285,390 813 1.13
278,520 973 1.39
Consumer CDs and IRAs
229,410 1,835 3.18
218,862 1,852 3.37
Negotiable CDs, public funds and other time deposits
36,510 270 2.94
36,039 291 3.21
Total domestic interest-bearing deposits
582,871 2,976 2.03
565,718 3,174 2.23
Foreign interest-bearing deposits:
Banks located in foreign countries
41,398 125 1.20
36,230 266 2.91
Governments and official institutions
13,738 30 0.87
11,847 72 2.43
Time, savings and other
48,836 165 1.34
48,209 334 2.76
Total foreign interest-bearing deposits
103,972 320 1.22
96,286 672 2.78
Total interest-bearing deposits
686,843 3,296 1.91
662,004 3,846 2.31
Federal funds purchased, securities sold under agreements to
repurchase and other short-term borrowings
459,743 1,910 1.65
465,511 3,223 2.76
Trading account liabilities
70,859 524 2.94
77,271 661 3.40
Long-term debt
255,709 2,766 4.32
264,934 2,824 4.26
Total interest-bearing liabilities
(6)
1,473,154 8,496 2.30
1,469,720 10,554 2.86
Noninterest-bearing sources:
Noninterest-bearing deposits
205,298
195,841
Other liabilities
93,836
73,676
Shareholders’ equity
176,566
166,454
Total liabilities and shareholders’ equity
$1,948,854
$1,905,691
Net interest spread
3.10%
2.66%
Impact of noninterest-bearing sources
0.21
0.27
Net interest income/yield on earning assets
$13,406 3.31%
$11,920 2.93%
(1) Yields on AFS debt securities are calculated based on fair value rather than historical cost balances. The use of fair value does not have a material impact on net interest yield.
(2) Nonperforming loans are included in the respective average loan balances. Income on these nonperforming loans is recognized on a cash basis. We account for acquired impaired loans in accordance with SOP 03-3.
Loans accounted for in accordance with SOP 03-3 were written down to fair value upon acquisition and accrete interest income over the remaining life of the loan.
(3) Includes foreign consumer loans of $2.0 billion, $2.6 billion, $3.0 billion and $3.3 billion in the fourth, third, second and first quarters of 2008, and $3.6 billion in the fourth quarter of 2007, respectively.
(4) Includes consumer finance loans of $2.7 billion, $2.7 billion, $2.8 billion and $3.0 billion in the fourth, third, second and first quarters of 2008, and $3.1 billion in the fourth quarter of 2007, respectively; and other
foreign consumer loans of $654 million, $725 million, $862 million and $857 million in the fourth, third, second and first quarters of 2008, and $845 million in the fourth quarter of 2007, respectively.
(5) Includes domestic commercial real estate loans of $63.6 billion, $62.2 billion, $61.6 billion and $61.0 billion in the fourth, third, second and first quarters of 2008, and $58.5 billion in the fourth quarter of 2007,
respectively.
(6) Interest income includes the impact of interest rate risk management contracts, which decreased interest income on assets $41 million, $12 million, $104 million and $103 million in the fourth, third, second and first
quarters of 2008, and $134 million in the fourth quarter of 2007, respectively. Interest expense includes the impact of interest rate risk management contracts, which increased interest expense on liabilities $237
million, $86 million, $37 million and $49 million in the fourth, third, second and first quarters of 2008, and $201 million in the fourth quarter of 2007, respectively. For further information on interest rate contracts,
see Interest Rate Risk Management for Nontrading Activities beginning on page 88.
Bank of America 2008
109