Bank of America 2008 Annual Report Download - page 147
Download and view the complete annual report
Please find page 147 of the 2008 Bank of America annual report below. You can navigate through the pages in the report by either clicking on the pages listed below, or by using the keyword search tool below to find specific information within the annual report.-
 1
1 -
2
-
3
-
4
-
5
-
6
-
7
-
8
-
9
-
10
-
11
-
12
-
13
-
14
-
15
-
16
-
17
-
18
-
19
-
20
-
21
-
22
-
23
-
24
-
25
-
26
-
27
-
28
-
29
-
30
-
31
-
32
-
33
-
34
-
35
-
36
-
37
-
38
-
39
-
40
-
41
-
42
-
43
-
44
-
45
-
46
-
47
-
48
-
49
-
50
-
51
-
52
-
53
-
54
-
55
-
56
-
57
-
58
-
59
-
60
-
61
-
62
-
63
-
64
-
65
-
66
-
67
-
68
-
69
-
70
-
71
-
72
-
73
-
74
-
75
-
76
-
77
-
78
-
79
-
80
-
81
-
82
-
83
-
84
-
85
-
86
-
87
-
88
-
89
-
90
-
91
-
92
-
93
-
94
-
95
-
96
-
97
-
98
-
99
-
100
-
101
-
102
-
103
-
104
-
105
-
106
-
107
-
108
-
109
-
110
-
111
-
112
-
113
-
114
-
115
-
116
-
117
-
118
-
119
-
120
-
121
-
122
-
123
-
124
-
125
-
126
-
127
-
128
-
129
-
130
-
131
-
132
-
133
-
134
-
135
-
136
-
 137
137 -
 138
138 -
 139
139 -
 140
140 -
 141
141 -
 142
142 -
 143
143 -
 144
144 -
 145
145 -
 146
146 -
 147
147 -
 148
148 -
 149
149 -
 150
150 -
 151
151 -
 152
152 -
 153
153 -
 154
154 -
 155
155 -
 156
156 -
 157
157 -
158
-
159
-
160
-
161
-
162
-
163
-
164
-
165
-
166
-
167
-
168
-
169
-
170
-
171
-
172
-
173
-
174
-
175
-
176
-
177
-
178
-
179
-
180
-
181
-
182
-
183
-
184
-
185
-
186
-
187
-
188
-
189
-
190
-
191
-
192
-
193
-
194
-
195
 |
 |

Unconsolidated VIEs
(Dollars in millions)
Multi-
Seller
Conduits
Asset
Acquisition
Conduits
Municipal
Bond
Trusts CDOs
Real Estate
Investment
Vehicles
Customer
Vehicles
Other
Vehicles Total
Unconsolidated VIEs, December 31, 2008 (1)
Maximum loss exposure
(2)
$42,046 $2,622 $7,145 $ 2,383 $5,696 $ 5,741 $4,337
$69,970
Total assets of VIEs 27,922 2,622 7,997 2,570 5,980 6,032 7,280
60,403
On-Balance Sheet Assets
Trading account assets $ 1 $ 1 $ 688 $ 732 $ – $ 2,877 $ 145
$ 4,444
Derivative assets – 293 379 6 – 2,864 –
3,542
Available-for-sale debt securities – – – 1,039 – – 5
1,044
Loans and leases 388 – – – – – 1,004
1,392
All other assets 23 – – – 4,996 – 1,765
6,784
Total $ 412 $ 294 $1,067 $ 1,777 $4,996 $ 5,741 $2,919
$17,206
On-Balance Sheet Liabilities
Derivative liabilities $ – $ 293 $ 27 $ 57 $ – $ – $ 85
$ 462
All other liabilities – – – – 1,632 – 80
1,712
Total $ – $ 293 $ 27 $ 57 $1,632 $ – $ 165
$ 2,174
Unconsolidated VIEs, December 31, 2007 (1)
Maximum loss exposure
(2)
$47,335 $6,399 $6,341 $11,135 $5,009 $ 9,114 $6,199
$91,532
Total assets of VIEs 29,363 6,399 6,361 13,300 5,138 11,725 9,562
81,848
(1) Includes unconsolidated VIEs and certain QSPEs which are not included in Note 8 – Securitizations to the Consolidated Financial Statements.
(2) Maximum loss exposure for unconsolidated VIEs includes on-balance sheet assets plus off-balance sheet exposures. It does not include losses previously recognized through write-downs of assets or the establishment
of derivative or other liabilities.
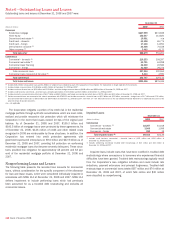
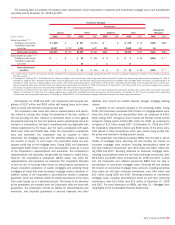
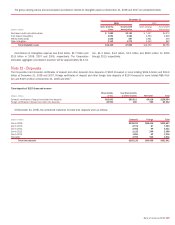
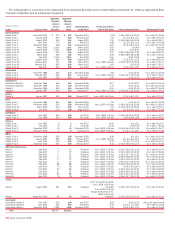
The table above presents total assets of unconsolidated VIEs in which
the Corporation holds a significant variable interest and Corporation-
sponsored unconsolidated VIEs in which the Corporation holds a variable
interest, even if not significant, at December 31, 2008 and 2007. The
table also presents the Corporation’s maximum exposure to loss result-
ing from its involvement with these VIEs at December 31, 2008 and
2007. The Corporation’s maximum exposure to loss is based on the
unlikely event that all of the assets in the VIEs become worthless and
incorporates not only potential losses associated with assets recorded on
the Corporation’s balance sheet but also potential losses associated with
off-balance sheet commitments such as unfunded liquidity commitments
and other contractual arrangements. Certain QSPEs in which the Corpo-
ration has continuing involvement but that are not discussed in Note 8 –
Securitizations to the Consolidated Financial Statements are also
included in the table. Assets and liabilities of unconsolidated VIEs
recorded on the Corporation’s Consolidated Balance Sheet at
December 31, 2008 are also summarized above.
Except as described below, we have not provided financial or other
support to consolidated or unconsolidated VIEs that we were not pre-
viously contractually required to provide, nor do we intend to do so.
Multi-Seller Conduits
The Corporation administers four multi-seller conduits which provide a
low-cost funding alternative to its customers by facilitating their access to
the commercial paper market. These customers sell or otherwise transfer
assets to the conduits, which in turn issue short-term commercial paper
that is rated high-grade and is collateralized by the underlying assets. The
Corporation receives fees for providing combinations of liquidity and
SBLCs or similar loss protection commitments to the conduits. The
Corporation also receives fees for serving as commercial paper place-
ment agent and for providing administrative services to the conduits. The
Corporation’s liquidity commitments are collateralized by various classes
of assets which incorporate features such as overcollateralization and
cash reserves that are designed to provide credit support to the conduits
at a level equivalent to investment grade as determined in accordance
with internal risk rating guidelines. Third parties participate in a small
number of the liquidity facilities on a pari passu basis with the Corpo-
ration.
The Corporation determines whether it must consolidate a multi-seller
conduit based on an analysis of projected cash flows using Monte Carlo
simulations which are driven principally by credit risk inherent in the
assets of the conduits. Interest rate risk is not included in the cash flow
analysis because the conduits are not designed to absorb and pass along
interest rate risk to investors. Instead, the assets of the conduits pay
variable rates of interest based on the conduits’ funding costs. The
assets of the conduits typically carry a risk rating of AAA to BBB based on
the Corporation’s current internal risk rating equivalent, which reflects
structural enhancements of the assets, including third party insurance.
Projected loss calculations are based on maximum binding commitment
amounts, probability of default based on the average one year Moody’s
Corporate Finance transition table, and recovery rates of 90 percent, 65
percent and 45 percent for senior, mezzanine and subordinate
exposures. Approximately 97 percent of commitments in the uncon-
solidated conduits and 70 percent of commitments in the consolidated
conduit are senior exposures. Certain assets funded by one of the uncon-
solidated conduits benefit from embedded credit enhancement provided
by the Corporation. Credit risk created by these assets is deemed to be
credit risk of the Corporation, which is absorbed by third party investors.
The Corporation does not consolidate three conduits as it does not
expect to absorb a majority of the variability created by the credit risk of
the assets held in the conduits. On a combined basis, these three con-
duits have issued approximately $97 million of capital notes and equity
interests to third parties, $92 million of which were outstanding at
December 31, 2008. These instruments will absorb credit risk on a first
loss basis. The Corporation consolidates the fourth conduit, which has
not issued capital notes or equity interests to third parties.
At December 31, 2008, liquidity commitments to the consolidated
conduit were mainly collateralized by credit card loans (25 percent), auto
loans (14 percent), equipment loans (10 percent), corporate and
commercial loans (seven percent), and trade receivables (six percent).
None of these assets are subprime residential mortgages. In addition, 29
percent of the Corporation’s liquidity commitments were collateralized by
projected cash flows from long-term contracts (e.g., television broadcast
contracts, stadium revenues and royalty payments) which, as mentioned
above, incorporate features that provide credit support. Amounts
advanced under these arrangements will be repaid when cash flows due
Bank of America 2008
145