Bank of America 2008 Annual Report Download - page 78
Download and view the complete annual report
Please find page 78 of the 2008 Bank of America annual report below. You can navigate through the pages in the report by either clicking on the pages listed below, or by using the keyword search tool below to find specific information within the annual report.-
 1
1 -
2
-
3
-
4
-
5
-
6
-
7
-
8
-
9
-
10
-
11
-
12
-
13
-
14
-
15
-
16
-
17
-
18
-
19
-
20
-
21
-
22
-
23
-
24
-
25
-
26
-
27
-
28
-
29
-
30
-
31
-
32
-
33
-
34
-
35
-
36
-
37
-
38
-
39
-
40
-
41
-
42
-
43
-
44
-
45
-
46
-
47
-
48
-
49
-
50
-
51
-
52
-
53
-
54
-
55
-
56
-
57
-
58
-
59
-
60
-
61
-
62
-
63
-
64
-
65
-
66
-
67
-
 68
68 -
 69
69 -
 70
70 -
 71
71 -
 72
72 -
 73
73 -
 74
74 -
 75
75 -
 76
76 -
 77
77 -
 78
78 -
 79
79 -
 80
80 -
 81
81 -
 82
82 -
 83
83 -
 84
84 -
 85
85 -
 86
86 -
 87
87 -
 88
88 -
89
-
90
-
91
-
92
-
93
-
94
-
95
-
96
-
97
-
98
-
99
-
100
-
101
-
102
-
103
-
104
-
105
-
106
-
107
-
108
-
109
-
110
-
111
-
112
-
113
-
114
-
115
-
116
-
117
-
118
-
119
-
120
-
121
-
122
-
123
-
124
-
125
-
126
-
127
-
128
-
129
-
130
-
131
-
132
-
133
-
134
-
135
-
136
-
137
-
138
-
139
-
140
-
141
-
142
-
143
-
144
-
145
-
146
-
147
-
148
-
149
-
150
-
151
-
152
-
153
-
154
-
155
-
156
-
157
-
158
-
159
-
160
-
161
-
162
-
163
-
164
-
165
-
166
-
167
-
168
-
169
-
170
-
171
-
172
-
173
-
174
-
175
-
176
-
177
-
178
-
179
-
180
-
181
-
182
-
183
-
184
-
185
-
186
-
187
-
188
-
189
-
190
-
191
-
192
-
193
-
194
-
195
 |
 |
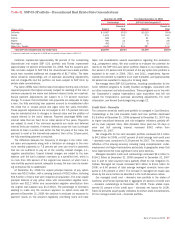
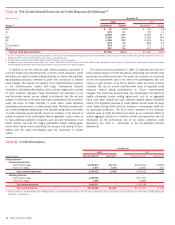
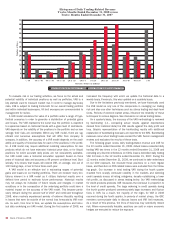
Industry Concentrations
Table 30 presents commercial committed and commercial utilized credit
exposure by industry and the total net credit default protection purchased
to cover the funded and the unfunded portion of certain credit exposure.
Our commercial credit exposure is diversified across a broad range of
industries.
Industry limits are used internally to manage industry concentrations
and are based on committed exposure and capital usage that are allo-
cated on an industry-by-industry basis. A risk management framework is
in place to set and approve industry limits, as well as to provide ongoing
monitoring. The CRC oversees industry limits governance.
Total commercial committed credit exposure increased by $18.3 billion,
or two percent, at December 31, 2008 compared to 2007 largely driven by
diversified financials partially offset by a decline in commercial real estate.
Total commercial utilized credit exposure increased by $46.8 billion, or 10
percent, at December 31, 2008 compared to 2007. The overall commercial
credit utilization rate increased year over year, increasing from 57 percent to
62 percent due to increases in diversified financials, government and public
education, and healthcare and equipment services.
Real estate remains our largest industry concentration, accounting for
13 percent of total commercial committed exposure, of which 15 percent
is homebuilder exposure. A decrease of $7.9 billion, or seven percent,
was driven primarily by a decline in CMBS assets held-for-sale as a result
of sales and distributions, completed securitizations and writedowns.
Diversified financials grew by $17.2 billion, or 20 percent reflecting
increases in capital markets exposure and consumer finance commit-
ments. Part of the increase was driven by a $3.7 billion fully committed
secured credit facility as well as a $4.0 billion FDIC guaranteed facility,
both of which were with Merrill Lynch. These facilities were terminated
following the completion of the acquisition. The increase in consumer
finance commitments was driven primarily by liquidity support associated
with the financing of credit card and auto finance related assets within
the Corporation’s multi-seller unconsolidated asset backed commercial
paper conduits.
Healthcare equipment and services increased $5.8 billion or 14 per-
cent due to loan growth primarily to not-for-profit healthcare providers.
This was driven primarily by increased demand for liquidity and credit
instruments to support variable rate demand notes (VRDNs) caused by
dislocations in the ARS markets. Consumer services increased $5.3 bil-
lion, or 14 percent driven primarily by growth in the education (private
colleges and universities) sector also resulting from the ARS dislocation.
Food, beverage and tobacco increased $2.8 billion, or 11 percent due to
growth in food products and a large underwritten transaction. Banks
decreased by $8.8 billion or 25 percent, reflecting the termination of a
$5.0 billion commitment to Countrywide.
Government and public education utilizations increased $7.6 billion
due to new refinancings of ARS into letter-of-credit backed VRDNs and the
restructuring of monoline insured VRDNs into uninsured VRDNs. Total
committed exposure increased by $1.2 billion, as the increases in the
utilized balance were partially offset by a reduction in certain unutilized
credit lines.
Monoline exposure is reported in the insurance industry and managed
under insurance portfolio industry limits. Direct loan exposure to mono-
lines consisted of revolvers in the amount of $126 million at
December 31, 2008 and $203 million at December 31, 2007.
Mark-to-market counterparty derivative credit exposure was $2.6 billion at
December 31, 2008 compared to $420 million at December 31, 2007.
The increase in the mark-to-market exposure was due to credit deterio-
ration related to underlying counterparties and spread widening in both
wrapped CDO and structured finance related exposures. At December 31,
2008, the counterparty credit valuation adjustment related to monoline
derivative exposure was $1.0 billion, which reduced our net
mark-to-market exposure to $1.6 billion. We do not hold collateral against
these derivative exposures. During the first quarter of 2009, one mono-
line counterparty restructured its business and had its credit rating down-
graded. We are currently evaluating the impact this restructuring and
downgrade will have on Merrill Lynch as well as our related counterparty
credit valuation adjustment and the combined company’s 2009 financial
results.
We have indirect exposure to monolines primarily in the form of guar-
antees supporting our loans, investment portfolios, securitizations, credit
enhanced securities as part of our public finance business and other
selected products. Such indirect exposure exists when we purchase
credit protection from monolines to hedge all or a portion of the credit
risk on certain credit exposures including loans and CDOs. We underwrite
our public finance exposure by evaluating the underlying securities. In the
case of default we first look to the underlying securities and then to
recovery on the purchased insurance. See page 41 for discussion on our
CDO exposure and related credit protection.
We also have indirect exposure as we invest in securities where the
issuers have purchased wraps (i.e., insurance). For example, municipal-
ities and corporations purchase protection in order to enhance their pric-
ing power which has the effect of reducing their cost of borrowings. If the
rating agencies downgrade the monolines, the credit rating of the bond
may fall and may have an adverse impact on the market value of the
security.
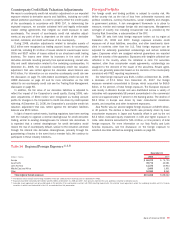
We have further monoline related exposure in our public finance busi-
ness where we are the lead manager or remarketing agent for trans-
actions that are wrapped including ARS (healthcare providers and
consumer services), tender option municipal bonds (TOBs), and VRDNs.
Continuing concerns about monoline downgrades or insolvency have
caused disruptions in each of these markets as investor concerns have
impacted overall market liquidity and bond prices. For more information
on ARS, see Recent Events beginning on page 22. We no longer serve as
the lead manager on municipal or student loan ARS where a high
percentage of the programs are wrapped by either monolines or other
financial guarantors. We are the remarketing agent on TOBs and VRDN
transactions and also provide commitments on approximately $13.6 bil-
lion of VRDNs, which increased approximately $2.2 billion during the year,
driven by the conversion by clients of ARS to VRDN structures, including
those issued by municipalities and other organizations. These commit-
ments obligate us to purchase the VRDNs in the event that they can not
be remarketed or otherwise provide funding to the issuer, and are primar-
ily held and reported in government and education related industry portfo-
lios and managed under respective industry limits.
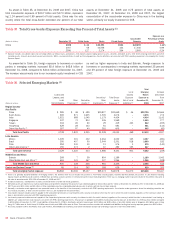
In addition, at December 31, 2008, we also held approximately $1.3
billion in ARS, $1.5 billion in VRDNs and $3.0 billion in TOBs acquired in
connection with these activities which are included in trading account
assets. During 2008, we recorded losses of $1.1 billion on the ARS,
primarily related to student loan-backed securities, including our commit-
ment to repurchase ARS from certain clients as part of a settlement
agreement with regulatory agencies. We did not record any losses on the
VRDNs and only minimal losses on the TOBs during the year. We continue
to have liquidity exposure to these markets and instruments. As market
conditions continue to evolve, these conditions may impact our results.
For additional information on our liquidity exposure to TOBs, see the
Municipal Bond Trusts discussion within the Off- and On-Balance Sheet
Arrangements discussion beginning on page 49 and Note 9 – Variable
Interest Entities to the Consolidated Financial Statements.
76
Bank of America 2008