Bank of America 2008 Annual Report Download - page 50
Download and view the complete annual report
Please find page 50 of the 2008 Bank of America annual report below. You can navigate through the pages in the report by either clicking on the pages listed below, or by using the keyword search tool below to find specific information within the annual report.-
 1
1 -
2
-
3
-
4
-
5
-
6
-
7
-
8
-
9
-
10
-
11
-
12
-
13
-
14
-
15
-
16
-
17
-
18
-
19
-
20
-
21
-
22
-
23
-
24
-
25
-
26
-
27
-
28
-
29
-
30
-
31
-
32
-
33
-
34
-
35
-
36
-
37
-
38
-
39
-
 40
40 -
 41
41 -
 42
42 -
 43
43 -
 44
44 -
 45
45 -
 46
46 -
 47
47 -
 48
48 -
 49
49 -
 50
50 -
 51
51 -
 52
52 -
 53
53 -
 54
54 -
 55
55 -
 56
56 -
 57
57 -
 58
58 -
 59
59 -
 60
60 -
61
-
62
-
63
-
64
-
65
-
66
-
67
-
68
-
69
-
70
-
71
-
72
-
73
-
74
-
75
-
76
-
77
-
78
-
79
-
80
-
81
-
82
-
83
-
84
-
85
-
86
-
87
-
88
-
89
-
90
-
91
-
92
-
93
-
94
-
95
-
96
-
97
-
98
-
99
-
100
-
101
-
102
-
103
-
104
-
105
-
106
-
107
-
108
-
109
-
110
-
111
-
112
-
113
-
114
-
115
-
116
-
117
-
118
-
119
-
120
-
121
-
122
-
123
-
124
-
125
-
126
-
127
-
128
-
129
-
130
-
131
-
132
-
133
-
134
-
135
-
136
-
137
-
138
-
139
-
140
-
141
-
142
-
143
-
144
-
145
-
146
-
147
-
148
-
149
-
150
-
151
-
152
-
153
-
154
-
155
-
156
-
157
-
158
-
159
-
160
-
161
-
162
-
163
-
164
-
165
-
166
-
167
-
168
-
169
-
170
-
171
-
172
-
173
-
174
-
175
-
176
-
177
-
178
-
179
-
180
-
181
-
182
-
183
-
184
-
185
-
186
-
187
-
188
-
189
-
190
-
191
-
192
-
193
-
194
-
195
 |
 |

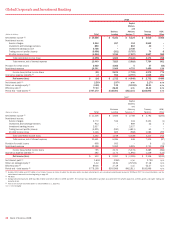
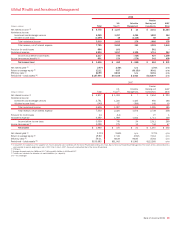
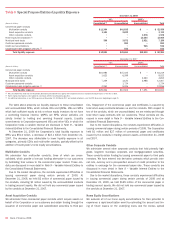
All Other
2008 2007
(Dollars in millions)
Reported
Basis
(1)
Securitization
Offset
(2)
As
Adjusted
Reported
Basis
(1)
Securitization
Offset
(2)
As
Adjusted
Net interest income
(3)
$(8,610)
$ 8,701 $ 91 $(7,645) $ 8,027 $ 382
Noninterest income:
Card income
2,164
(2,250) (86) 2,817 (3,356) (539)
Equity investment income
265
– 265 3,745 – 3,745
Gains on sales of debt securities
1,133
– 1,133 180 – 180
All other income (loss)
(545)
219 (326) 426 288 714
Total noninterest income
3,017
(2,031) 986 7,168 (3,068) 4,100
Total revenue, net of interest expense
(5,593)
6,670 1,077 (477) 4,959 4,482
Provision for credit losses
(3,760)
6,670 2,910 (5,207) 4,959 (248)
Merger and restructuring charges
(4)
935
– 935 410 – 410
All other noninterest expense
372
– 372 87 – 87
Income (loss) before income taxes
(3,140)
– (3,140) 4,233 – 4,233
Income tax expense (benefit)
(3)
(1,512)
– (1,512) 1,083 – 1,083
Net income (loss)
$(1,628)
$ – $(1,628) $ 3,150 $ – $3,150
(1) Provision for credit losses represents the provision for credit losses in All Other combined with the GCSBB securitization offset.
(2) The securitization offset on net interest income is on a funds transfer pricing methodology consistent with the way funding costs are allocated to the businesses.
(3) FTE basis
(4) For more information on merger and restructuring charges, see Note 2 – Merger and Restructuring Activity to the Consolidated Financial Statements.
GCSBB is reported on a managed basis which includes a
“securitization impact” adjustment which has the effect of assuming that
loans that have been securitized were not sold and presenting these
loans in a manner similar to the way loans that have not been sold are
presented. All Other’s results include a corresponding “securitization
offset” which removes the impact of these securitized loans in order to
present the consolidated results on a GAAP basis (i.e., held basis). See
the GCSBB section beginning on page 33 for information on the GCSBB
managed results. The following All Other discussion focuses on the
results on an as adjusted basis excluding the securitization offset. For
additional information, see Note 22 – Business Segment Information to
the Consolidated Financial Statements.
In addition to the securitization offset discussed above, All Other
includes our Equity Investments businesses and Other.
Equity Investments includes Principal Investing, Corporate Invest-
ments and Strategic Investments. Principal Investing is comprised of a
diversified portfolio of investments in privately-held and publicly-traded
companies at all stages of their life cycle from start-up to buyout. These
investments are made either directly in a company or held through a fund
and are accounted for at fair value. In addition, Principal Investing has
unfunded equity commitments related to some of these investments. For
more information on these commitments, see Note 13 – Commitments
and Contingencies to the Consolidated Financial Statements.
Corporate Investments primarily includes investments in publicly-
traded debt and equity securities and funds which are accounted for as
AFS marketable equity securities. Strategic Investments includes invest-
ments of $19.7 billion in CCB, $2.5 billion in Banco Itaú, $2.1 billion in
Grupo Financiero Santander, S.A. (Santander) and other investments. In
2008, under the terms of our purchase option we increased our owner-
ship in CCB by purchasing 25.6 billion common shares for approximately
$9.2 billion. These recently purchased shares are accounted for at cost
in other assets and are non-transferable until August 2011. In addition, in
January 2009, we sold 5.6 billion common shares of our initial invest-
ment in CCB for $2.8 billion, reducing our ownership to 16.7 percent and
resulting in a pre-tax gain of approximately $1.9 billion. The remaining
initial investment of 13.5 billion common shares is accounted for at fair
value and recorded as AFS marketable equity securities in other assets
with an offset, net-of-tax, to accumulated OCI. These shares became
transferable in October 2008. The restricted shares of Banco Itaú are
carried at fair value with an offset, net-of-tax, to accumulated OCI and are
accounted for as AFS marketable equity securities. Prior to the second
quarter of 2008, these shares were accounted for at cost. Our invest-
ment in Santander is accounted for under the equity method of account-
ing. Income associated with Equity Investments is recorded in equity
investment income.
Other includes the residential mortgage portfolio associated with ALM
activities, the residual impact of the cost allocation processes, merger
and restructuring charges, intersegment eliminations, and the results of
certain businesses that are expected to be or have been sold or are in
the process of being liquidated. Other also includes certain amounts
associated with ALM activities, including the residual impact of funds
transfer pricing allocation methodologies, amounts associated with the
change in the value of derivatives used as economic hedges of interest
rate and foreign exchange rate fluctuations that do not qualify for SFAS
133 hedge accounting treatment, foreign exchange rate fluctuations
related to SFAS 52 revaluation of foreign denominated debt issuances,
certain gains (losses) on sales of whole mortgage loans, and gains
(losses) on sales of debt securities. Other also includes adjustments to
noninterest income and income tax expense to remove the FTE impact of
items (primarily low-income housing tax credits) that have been grossed
up within noninterest income to a FTE amount in the business segments.
Net income decreased $4.8 billion to a net loss of $1.6 billion due to
a decrease in total revenue combined with increases in provision for
credit losses and merger and restructuring charges.
Net interest income decreased $291 million resulting largely from the
reclassification to card income related to our funds transfer pricing for
Card Services’ securitizations. This reclassification is performed to pres-
ent our consolidated results on a held basis.
Noninterest income declined $3.1 billion to $986 million driven by
decreases in equity investment income of $3.5 billion and all other
income (loss) of $1.0 billion partially offset by increases in gains on sales
of debt securities of $953 million and card income of $453 million.
48
Bank of America 2008