Bank of America 2008 Annual Report Download - page 191
Download and view the complete annual report
Please find page 191 of the 2008 Bank of America annual report below. You can navigate through the pages in the report by either clicking on the pages listed below, or by using the keyword search tool below to find specific information within the annual report.-
 1
1 -
2
-
3
-
4
-
5
-
6
-
7
-
8
-
9
-
10
-
11
-
12
-
13
-
14
-
15
-
16
-
17
-
18
-
19
-
20
-
21
-
22
-
23
-
24
-
25
-
26
-
27
-
28
-
29
-
30
-
31
-
32
-
33
-
34
-
35
-
36
-
37
-
38
-
39
-
40
-
41
-
42
-
43
-
44
-
45
-
46
-
47
-
48
-
49
-
50
-
51
-
52
-
53
-
54
-
55
-
56
-
57
-
58
-
59
-
60
-
61
-
62
-
63
-
64
-
65
-
66
-
67
-
68
-
69
-
70
-
71
-
72
-
73
-
74
-
75
-
76
-
77
-
78
-
79
-
80
-
81
-
82
-
83
-
84
-
85
-
86
-
87
-
88
-
89
-
90
-
91
-
92
-
93
-
94
-
95
-
96
-
97
-
98
-
99
-
100
-
101
-
102
-
103
-
104
-
105
-
106
-
107
-
108
-
109
-
110
-
111
-
112
-
113
-
114
-
115
-
116
-
117
-
118
-
119
-
120
-
121
-
122
-
123
-
124
-
125
-
126
-
127
-
128
-
129
-
130
-
131
-
132
-
133
-
134
-
135
-
136
-
137
-
138
-
139
-
140
-
141
-
142
-
143
-
144
-
145
-
146
-
147
-
148
-
149
-
150
-
151
-
152
-
153
-
154
-
155
-
156
-
157
-
158
-
159
-
160
-
161
-
162
-
163
-
164
-
165
-
166
-
167
-
168
-
169
-
170
-
171
-
172
-
173
-
174
-
175
-
176
-
177
-
178
-
179
-
180
-
 181
181 -
 182
182 -
 183
183 -
 184
184 -
 185
185 -
 186
186 -
 187
187 -
 188
188 -
 189
189 -
 190
190 -
 191
191 -
 192
192 -
 193
193 -
 194
194 -
 195
195
 |
 |

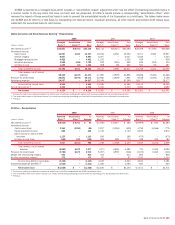
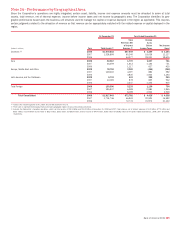
Note 24 – Performance by Geographical Area
Since the Corporation’s operations are highly integrated, certain asset, liability, income and expense amounts must be allocated to arrive at total
assets, total revenue, net of interest expense, income before income taxes and net income by geographic area. The Corporation identifies its geo-
graphic performance based upon the business unit structure used to manage the capital or expense deployed in the region as applicable. This requires
certain judgments related to the allocation of revenue so that revenue can be appropriately matched with the related expense or capital deployed in the
region.
At December 31 Year Ended December 31
(Dollars in millions) Year Total Assets
(1)
Total
Revenue, Net
of Interest
Expense
(2)
Income
(Loss)
Before
Income Taxes
Net Income
(Loss)
Domestic
(3)
2008 $1,678,853 $67,549 $ 3,289 $ 3,254
2007 1,529,899 60,245 18,039 13,137
2006 64,577 28,041 18,605
Asia
2008 50,567 1,770 1,207 761
2007 46,359 1,613 1,146 721
2006 1,117 637 420
Europe, Middle East and Africa
2008 78,790 3,020 (456) (252)
2007 129,303 4,097 894 592
2006 4,835 1,843 1,193
Latin America and the Caribbean
2008 9,733 443 388 245
2007 10,185 878 845 532
2006 2,247 1,452 915
Total Foreign
2008 139,090 5,233 1,139 754
2007 185,847 6,588 2,885 1,845
2006 8,199 3,932 2,528
Total Consolidated
2008 $1,817,943 $72,782 $ 4,428 $ 4,008
2007 1,715,746 66,833 20,924 14,982
2006 72,776 31,973 21,133
(1) Total assets include long-lived assets, which are primarily located in the U.S.
(2) There were no material intercompany revenues between geographic regions for any of the periods presented.
(3) Includes the Corporation’s Canadian operations, which had total assets of $13.5 billion and $10.9 billion at December 31, 2008 and 2007; total revenue, net of interest expense of $1.2 billion, $770 million and
$636 million; income before income taxes of $552 million, $292 million and $269 million; and net income of $404 million, $195 million and $182 million for the years ended December 31, 2008, 2007 and 2006,
respectively.
Bank of America 2008
189