Bank of America 2008 Annual Report Download - page 39
Download and view the complete annual report
Please find page 39 of the 2008 Bank of America annual report below. You can navigate through the pages in the report by either clicking on the pages listed below, or by using the keyword search tool below to find specific information within the annual report.-
 1
1 -
2
-
3
-
4
-
5
-
6
-
7
-
8
-
9
-
10
-
11
-
12
-
13
-
14
-
15
-
16
-
17
-
18
-
19
-
20
-
21
-
22
-
23
-
24
-
25
-
26
-
27
-
28
-
 29
29 -
 30
30 -
 31
31 -
 32
32 -
 33
33 -
 34
34 -
 35
35 -
 36
36 -
 37
37 -
 38
38 -
 39
39 -
 40
40 -
 41
41 -
 42
42 -
 43
43 -
 44
44 -
 45
45 -
 46
46 -
 47
47 -
 48
48 -
 49
49 -
50
-
51
-
52
-
53
-
54
-
55
-
56
-
57
-
58
-
59
-
60
-
61
-
62
-
63
-
64
-
65
-
66
-
67
-
68
-
69
-
70
-
71
-
72
-
73
-
74
-
75
-
76
-
77
-
78
-
79
-
80
-
81
-
82
-
83
-
84
-
85
-
86
-
87
-
88
-
89
-
90
-
91
-
92
-
93
-
94
-
95
-
96
-
97
-
98
-
99
-
100
-
101
-
102
-
103
-
104
-
105
-
106
-
107
-
108
-
109
-
110
-
111
-
112
-
113
-
114
-
115
-
116
-
117
-
118
-
119
-
120
-
121
-
122
-
123
-
124
-
125
-
126
-
127
-
128
-
129
-
130
-
131
-
132
-
133
-
134
-
135
-
136
-
137
-
138
-
139
-
140
-
141
-
142
-
143
-
144
-
145
-
146
-
147
-
148
-
149
-
150
-
151
-
152
-
153
-
154
-
155
-
156
-
157
-
158
-
159
-
160
-
161
-
162
-
163
-
164
-
165
-
166
-
167
-
168
-
169
-
170
-
171
-
172
-
173
-
174
-
175
-
176
-
177
-
178
-
179
-
180
-
181
-
182
-
183
-
184
-
185
-
186
-
187
-
188
-
189
-
190
-
191
-
192
-
193
-
194
-
195
 |
 |

Production income increased $1.4 billion in 2008 compared to 2007.
This increase was driven by the Countrywide acquisition which resulted in
higher volumes, and an improvement in margins.
Net servicing income increased $1.7 billion in 2008 compared to
2007 due primarily to increases in the value of the MSR economic hedge
instruments of $8.6 billion partially offset by changes in the fair value of
MSRs of $6.7 billion. Generally, when mortgage interest rates decline, as
occurred during the second half of 2008, there is an increase in the value
of instruments used to economically hedge MSRs and a corresponding
decrease in the value of MSRs. The decrease in the value of MSRs during
the second half of 2008 was tempered by the expectation that weakness
in the housing market would decrease the impact of market interest rates
on expected future prepayments. For further discussion on MSRs and the
related hedge instruments, see Mortgage Banking Risk Management on
page 92.
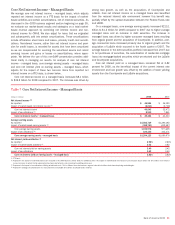
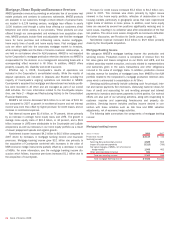
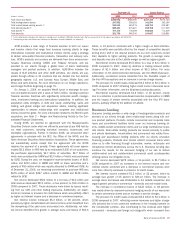
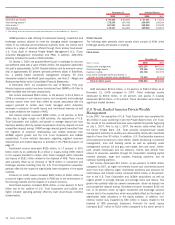
The following table presents select key indicators for MHEIS.
Mortgage, Home Equity and Insurance Services Key Statistics
(Dollars in millions, except as noted) 2008 2007
Loan production:
First mortgage
$128,945
$93,304
Home equity
31,998
69,226
Period end
Mortgage servicing portfolio (in billions)
(1)
2,057
517
Mortgage loans serviced for investors (in
billions)
1,654
259
Mortgage servicing rights:
Balance
12,733
3,053
Capitalized mortgage servicing rights (%
of loans serviced)
77bps
118bps
(1) Servicing of residential mortgage loans, home equity lines of credit, home equity loans and discontinued
real estate mortgage loans.
First mortgage and home equity production were $128.9 billion and
$32.0 billion in 2008 compared to $93.3 billion and $69.2 billion in
2007. The increase of $35.6 billion in first mortgage production was due
to the acquisition of Countrywide partially offset by decreased activity in
the mortgage market. The decrease of $37.2 billion in home equity pro-
duction was primarily due to more stringent underwriting guidelines for
home equity lines of credit and loans, and lower consumer demand.
The servicing portfolio at December 31, 2008 was $2.1 trillion, $1.5
trillion higher than at December 31, 2007, driven by the acquisition of
Countrywide. Included in this amount was $1.7 trillion of residential first
mortgage, home equity lines of credit and home equity loans serviced for
others.
At December 31, 2008, the consumer MSR balance was $12.7 bil-
lion, which represented 77 bps of the related unpaid principal balance as
compared to $3.1 billion, or 118 bps of the related principal balance at
December 31, 2007. The increase in the consumer MSR balance was
driven by $17.2 billion of MSRs that we acquired from Countrywide which
was partially offset by the impact of mortgage rates falling substantially
during the fourth quarter of 2008. As a result of the decline in rates, the
value of the MSRs decreased driven by a significant increase in expected
prepayments which reduced the expected life of the consumer MSRs.
This resulted in the 41 bps decrease in the capitalized MSRs as a per-
centage of loans serviced. MSR economic hedge results were more than
sufficient to offset this decrease.
Bank of America 2008
37