Bank of America 2008 Annual Report Download - page 90
Download and view the complete annual report
Please find page 90 of the 2008 Bank of America annual report below. You can navigate through the pages in the report by either clicking on the pages listed below, or by using the keyword search tool below to find specific information within the annual report.-
 1
1 -
2
-
3
-
4
-
5
-
6
-
7
-
8
-
9
-
10
-
11
-
12
-
13
-
14
-
15
-
16
-
17
-
18
-
19
-
20
-
21
-
22
-
23
-
24
-
25
-
26
-
27
-
28
-
29
-
30
-
31
-
32
-
33
-
34
-
35
-
36
-
37
-
38
-
39
-
40
-
41
-
42
-
43
-
44
-
45
-
46
-
47
-
48
-
49
-
50
-
51
-
52
-
53
-
54
-
55
-
56
-
57
-
58
-
59
-
60
-
61
-
62
-
63
-
64
-
65
-
66
-
67
-
68
-
69
-
70
-
71
-
72
-
73
-
74
-
75
-
76
-
77
-
78
-
79
-
 80
80 -
 81
81 -
 82
82 -
 83
83 -
 84
84 -
 85
85 -
 86
86 -
 87
87 -
 88
88 -
 89
89 -
 90
90 -
 91
91 -
 92
92 -
 93
93 -
 94
94 -
 95
95 -
 96
96 -
 97
97 -
 98
98 -
 99
99 -
 100
100 -
101
-
102
-
103
-
104
-
105
-
106
-
107
-
108
-
109
-
110
-
111
-
112
-
113
-
114
-
115
-
116
-
117
-
118
-
119
-
120
-
121
-
122
-
123
-
124
-
125
-
126
-
127
-
128
-
129
-
130
-
131
-
132
-
133
-
134
-
135
-
136
-
137
-
138
-
139
-
140
-
141
-
142
-
143
-
144
-
145
-
146
-
147
-
148
-
149
-
150
-
151
-
152
-
153
-
154
-
155
-
156
-
157
-
158
-
159
-
160
-
161
-
162
-
163
-
164
-
165
-
166
-
167
-
168
-
169
-
170
-
171
-
172
-
173
-
174
-
175
-
176
-
177
-
178
-
179
-
180
-
181
-
182
-
183
-
184
-
185
-
186
-
187
-
188
-
189
-
190
-
191
-
192
-
193
-
194
-
195
 |
 |

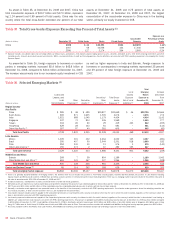
$47 million to $1.1 billion. This is down from $459 million to $1.5 billion
for the hypothetical scenarios for the 12 months ended December 31,
2007. The results of these stress tests point to a decrease in risk taken
during the 12 months ended December 31, 2008.
The acquisition of Merrill Lynch on January 1, 2009 increased our
trading-related activities and exposure. As such, during 2009 we will con-
tinue to refine the VAR calculations and develop a set of stress scenarios
that will be regularly produced across the combined company for pur-
poses of managing our overall risk profile. As of January 1, 2009, we
estimate that the VAR of the combined organizations would have been
$274 million as compared to $138 million for the Corporation. The
combination of VAR measurements is not additive as there are both corre-
lation and diversification effects that impact the results. For stress test-
ing, Merrill Lynch used similar shocks for hypothetical scenarios and as
of January 1, 2009, we estimate that the combined largest loss among
the hypothetical scenarios would have been $774 million. Among the
historical scenarios, comparable shocks were used to reflect the ongoing
credit crisis related to the credit market disruptions, which had previously
exhibited the largest loss among all historical scenarios at
the Corporation. As of January 1, 2009, we estimate that the combined
loss from the historical credit crisis scenario would have been $1.1 bil-
lion. For the Corporation, the loss from the historical credit crisis scenario
would have been $579 million.
Interest Rate Risk Management for Nontrading
Activities
Interest rate risk represents the most significant market risk exposure to
our nontrading exposures. Our overall goal is to manage interest rate risk
so that movements in interest rates do not adversely affect core net
interest income – managed basis. Interest rate risk is measured as the
potential volatility in our core net interest income – managed basis
caused by changes in market interest rates. Client facing activities, pri-
marily lending and deposit-taking, create interest rate sensitive positions
on our balance sheet. Interest rate risk from these activities, as well as
the impact of changing market conditions, is managed through our ALM
activities.
Simulations are used to estimate the impact on core net interest
income – managed basis using numerous interest rate scenarios, bal-
ance sheet trends and strategies. These simulations evaluate how these
scenarios impact core net interest income – managed basis on short-term
financial instruments, debt securities, loans, deposits, borrowings, and
derivative instruments. In addition, these simulations incorporate
assumptions about balance sheet dynamics such as loan and deposit
growth and pricing, changes in funding mix, and asset and liability repric-
ing and maturity characteristics. These simulations do not include the
impact of hedge ineffectiveness.
Management analyzes core net interest income – managed basis
forecasts utilizing different rate scenarios, with the base case utilizing the
forward interest rates. Management frequently updates the core net inter-
est income – managed basis forecast for changing assumptions and dif-
fering outlooks based on economic trends and market conditions. Thus,
we continually monitor our balance sheet position in an effort to maintain
an acceptable level of exposure to interest rate changes.
We prepare forward-looking forecasts of core net interest income –
managed basis. These baseline forecasts take into consideration
expected future business growth, ALM positioning, and the direction of
interest rate movements as implied by forward interest rates. We then
measure and evaluate the impact that alternative interest rate scenarios
have to these static baseline forecasts in order to assess interest rate
sensitivity under varied conditions. The spot and 12-month forward
monthly rates used in our respective baseline forecasts at December 31,
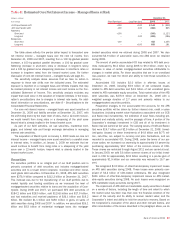
2008 and 2007 are shown in Table 40.
At December 31, 2008, the spread between the three-month LIBOR
rate and the Federal Funds target rate had significantly widened since
December 31, 2007. We are typically asset sensitive to Federal Funds
and Prime rates, and liability sensitive to LIBOR. As the Federal Funds
and LIBOR dislocation widens, the benefit to net interest income from
lower rates is limited. Subsequent to December 31, 2008, the spread
between the three-month LIBOR rate and the Federal Funds target rate
has narrowed.
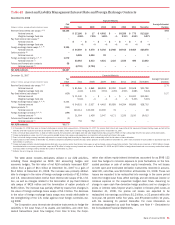
Table 40 Forward Rates
December 31
2008 2007
Federal
Funds
Three-Month
LIBOR
10-Year
Swap
Federal
Funds
Three-Month
LIBOR
10-Year
Swap
Spot rates
0.25% 1.43% 2.56%
4.25% 4.70% 4.67%
12-month forward rates
0.75
1.41 2.80 3.13 3.36 4.79
88
Bank of America 2008