Bank of America 2008 Annual Report Download - page 43
Download and view the complete annual report
Please find page 43 of the 2008 Bank of America annual report below. You can navigate through the pages in the report by either clicking on the pages listed below, or by using the keyword search tool below to find specific information within the annual report.-
 1
1 -
2
-
3
-
4
-
5
-
6
-
7
-
8
-
9
-
10
-
11
-
12
-
13
-
14
-
15
-
16
-
17
-
18
-
19
-
20
-
21
-
22
-
23
-
24
-
25
-
26
-
27
-
28
-
29
-
30
-
31
-
32
-
 33
33 -
 34
34 -
 35
35 -
 36
36 -
 37
37 -
 38
38 -
 39
39 -
 40
40 -
 41
41 -
 42
42 -
 43
43 -
 44
44 -
 45
45 -
 46
46 -
 47
47 -
 48
48 -
 49
49 -
 50
50 -
 51
51 -
 52
52 -
 53
53 -
54
-
55
-
56
-
57
-
58
-
59
-
60
-
61
-
62
-
63
-
64
-
65
-
66
-
67
-
68
-
69
-
70
-
71
-
72
-
73
-
74
-
75
-
76
-
77
-
78
-
79
-
80
-
81
-
82
-
83
-
84
-
85
-
86
-
87
-
88
-
89
-
90
-
91
-
92
-
93
-
94
-
95
-
96
-
97
-
98
-
99
-
100
-
101
-
102
-
103
-
104
-
105
-
106
-
107
-
108
-
109
-
110
-
111
-
112
-
113
-
114
-
115
-
116
-
117
-
118
-
119
-
120
-
121
-
122
-
123
-
124
-
125
-
126
-
127
-
128
-
129
-
130
-
131
-
132
-
133
-
134
-
135
-
136
-
137
-
138
-
139
-
140
-
141
-
142
-
143
-
144
-
145
-
146
-
147
-
148
-
149
-
150
-
151
-
152
-
153
-
154
-
155
-
156
-
157
-
158
-
159
-
160
-
161
-
162
-
163
-
164
-
165
-
166
-
167
-
168
-
169
-
170
-
171
-
172
-
173
-
174
-
175
-
176
-
177
-
178
-
179
-
180
-
181
-
182
-
183
-
184
-
185
-
186
-
187
-
188
-
189
-
190
-
191
-
192
-
193
-
194
-
195
 |
 |
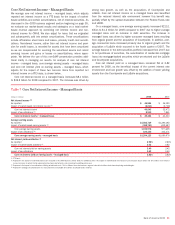
At December 31, 2008, we had no forward leveraged finance com-
mitments and the carrying value of our leveraged funded positions held
for distribution was $2.8 billion. At December 31, 2007, the carrying
value of the Corporation’s forward leveraged finance commitments and
leveraged funded positions held for distribution were $11.9 billion and
$5.9 billion. The elimination of our forward leveraged finance commit-
ments was due to the funding of previously outstanding commitments,
approximately 66 percent of which were distributed through syndi-
cation, and client-terminated commitments. Pre-market disruption
exposure originated prior to September 30, 2007 had a carrying value
of $1.5 billion at December 31, 2008 as compared to $5.9 billion at
December 31, 2007. At December 31, 2008, 66 percent of the lever-
aged funded positions held for distribution were senior secured with an
approximate carrying value of $1.9 billion of which $1.4 billion were
originated prior to September 30, 2007.
ŠStructured products sales and trading revenue was a loss of $8.0 bil-
lion, which represented a decline in revenue of $2.7 billion compared
to the prior year. The decrease was driven by $4.8 billion of losses
resulting from our CDO exposure, which includes our super senior,
warehouse, and sales and trading positions, and our hedging activities
including counterparty credit risk valuations. See the detailed CDO
exposure discussion to follow. Also, structured products was adversely
impacted by $944 million of losses (net of hedges) on CMBS funded
debt and the forward finance commitments for 2008, and $545 million
in losses associated with equity investments we made in acquisition-
related financing transactions. In addition, 2008 included losses
related to other structured products including $738 million of losses
for counterparty credit risk valuations related to our structured credit
trading business. Other structured products, including residential
mortgage-backed securities as well as other residual structured credit
positions were negatively impacted by spread widening and extreme
dislocations in basis correlations in both domestic and foreign markets
that occurred in the fourth quarter of 2008. The results of 2007 were
adversely impacted by the market disruptions that began during the
third quarter of 2007.
At December 31, 2008 and 2007, we held $6.9 billion and $13.6
billion of funded CMBS debt of which $6.0 billion and $8.9 billion were
primarily floating-rate acquisition-related financings to major, well-
known operating companies. In addition, at December 31, 2008 and
2007, we had forward finance commitments of $700 million and $2.2
billion. The decrease in funded CMBS debt was driven by securitiza-
tions and loan sales, while the decrease in forward finance commit-
ments was driven by the funding of outstanding commitments and the
business decision not to enter into any new floating-rate acquisition-
related financings. Forward finance commitments at December 31,
2008 were comprised primarily of fixed-rate conduit product financings.
The $944 million of losses recorded during 2008 associated with our
CMBS exposure were concentrated in the more difficult to hedge
floating-rate debt.
ŠEquity products sales and trading revenue decreased $512 million to
$813 million in 2008 compared to 2007 primarily due to lower trading
results in the institutional derivatives businesses and the sale of our
equity prime brokerage business that occurred in the third quarter of
2008.
Collateralized Debt Obligation Exposure at December 31, 2008
CDO vehicles hold diversified pools of fixed income securities. CDO
vehicles issue multiple tranches of debt securities, including commercial
paper, mezzanine and equity securities.
Our CDO exposure can be divided into funded and unfunded super
senior liquidity commitment exposure, other super senior exposure (i.e.,
cash positions and derivative contracts), warehouse, and sales and trad-
ing positions. For more information on our CDO liquidity commitments,
refer to Collateralized Debt Obligation Vehicles as part of Off- and
On-Balance Sheet Arrangements beginning on page 49. Super senior
exposure represents the most senior class of commercial paper or notes
that are issued by the CDO vehicles. These financial instruments benefit
from the subordination of all other securities issued by the CDO vehicles.
During 2008, we recorded CDO-related losses of $4.8 billion com-
pared to $5.6 billion in 2007 including losses on super senior exposure
of $3.6 billion and $4.0 billion. Also included in CDO-related losses in
2008 were $707 million of losses on purchased securities from liqui-
dated CDO vehicles. These securities were purchased from the vehicles
at auction and the losses were recorded subsequent to their purchase.
CDO-related losses reduced trading account profits (losses) by $1.6 bil-
lion and other income by $3.2 billion. Also included during 2008 were net
gains of $893 million related to our hedging activity, $315 million of
losses related to subprime sales and trading and CDO warehouse posi-
tions, and $1.1 billion of losses to cover counterparty risk on our CDO
and subprime-related exposure. The losses recorded in other income
noted above were other-than-temporary impairment charges related to
CDOs and purchased securities classified as AFS debt securities at
December 31, 2008. Also we had unrealized losses on uninsured other
super senior cash positions and purchased securities from liquidated
CDOs of $422 million (pre-tax) in accumulated OCI at December 31,
2008.
The CDO and related markets continued to deteriorate during 2008,
experiencing significant illiquidity impacting the availability and reliability
of transparent pricing. At December 31, 2008, we valued these CDO
structures consistent with how we valued them at December 31, 2007.
We assumed the CDO structures would terminate and looked through the
structures to the underlying net asset values of the securities. We were
able to obtain security values using either external pricing services or
offsetting trades for approximately 94 percent of the CDO exposure for
which we used the average of all prices obtained by security. The majority
of the remaining positions where no pricing quotes were available were
valued using matrix pricing by aligning the value to securities that had
similar vintage of underlying assets and ratings, using the lowest rating
between the rating services. The remaining securities were valued as
interest-only strips, based on estimated average life, exposure type and
vintage of the underlying assets. We assigned a zero value to the CDO
positions for which an event of default has been triggered and liquidation
notice has been issued. The value of cash held by the trustee for all CDO
structures was also incorporated into the resulting net asset value. In
addition, we were able to obtain security values using the same method-
ology as the CDO exposure for approximately 65 percent of the purchased
securities from liquidated CDOs. Similarly, the majority of the remaining
positions where no pricing quotes were available were valued using matrix
pricing and projected cash flows.
Bank of America 2008
41