Bank of America 2008 Annual Report Download - page 54
Download and view the complete annual report
Please find page 54 of the 2008 Bank of America annual report below. You can navigate through the pages in the report by either clicking on the pages listed below, or by using the keyword search tool below to find specific information within the annual report.-
 1
1 -
2
-
3
-
4
-
5
-
6
-
7
-
8
-
9
-
10
-
11
-
12
-
13
-
14
-
15
-
16
-
17
-
18
-
19
-
20
-
21
-
22
-
23
-
24
-
25
-
26
-
27
-
28
-
29
-
30
-
31
-
32
-
33
-
34
-
35
-
36
-
37
-
38
-
39
-
40
-
41
-
42
-
43
-
 44
44 -
 45
45 -
 46
46 -
 47
47 -
 48
48 -
 49
49 -
 50
50 -
 51
51 -
 52
52 -
 53
53 -
 54
54 -
 55
55 -
 56
56 -
 57
57 -
 58
58 -
 59
59 -
 60
60 -
 61
61 -
 62
62 -
 63
63 -
 64
64 -
65
-
66
-
67
-
68
-
69
-
70
-
71
-
72
-
73
-
74
-
75
-
76
-
77
-
78
-
79
-
80
-
81
-
82
-
83
-
84
-
85
-
86
-
87
-
88
-
89
-
90
-
91
-
92
-
93
-
94
-
95
-
96
-
97
-
98
-
99
-
100
-
101
-
102
-
103
-
104
-
105
-
106
-
107
-
108
-
109
-
110
-
111
-
112
-
113
-
114
-
115
-
116
-
117
-
118
-
119
-
120
-
121
-
122
-
123
-
124
-
125
-
126
-
127
-
128
-
129
-
130
-
131
-
132
-
133
-
134
-
135
-
136
-
137
-
138
-
139
-
140
-
141
-
142
-
143
-
144
-
145
-
146
-
147
-
148
-
149
-
150
-
151
-
152
-
153
-
154
-
155
-
156
-
157
-
158
-
159
-
160
-
161
-
162
-
163
-
164
-
165
-
166
-
167
-
168
-
169
-
170
-
171
-
172
-
173
-
174
-
175
-
176
-
177
-
178
-
179
-
180
-
181
-
182
-
183
-
184
-
185
-
186
-
187
-
188
-
189
-
190
-
191
-
192
-
193
-
194
-
195
 |
 |

tracts of $6.2 billion, commitments to purchase securities of $7.9 billion
and commitments to purchase loans of $14.3 billion. The most sig-
nificant of our vendor contracts include communication services, process-
ing services and software contracts. Other long-term liabilities include our
contractual funding obligations related to the Qualified Pension Plans,
Nonqualified Pension Plans and Postretirement Health and Life Plans (the
Plans). Obligations to the Plans are based on the current and projected
obligations of the Plans, performance of the Plans’ assets and any partic-
ipant contributions, if applicable. During 2008 and 2007, we contributed
$1.6 billion and $243 million to the Plans, and we expect to make at
least $229 million of contributions during 2009. The following table does
not include UTBs of $3.5 billion associated with FIN 48 and tax-related
interest and penalties of $677 million.
Debt, lease, equity and other obligations are more fully discussed in
Note 12 – Short-term Borrowings and Long-term Debt and Note 13 –
Commitments and Contingencies to the Consolidated Financial State-
ments. The Plans and UTBs are more fully discussed in Note 16 –
Employee Benefit Plans and Note 18 – Income Taxes to the Consolidated
Financial Statements.
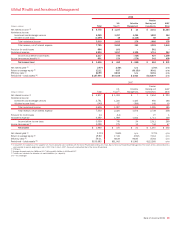
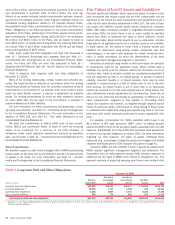
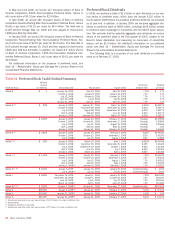
Table 9 presents total long-term debt and other obligations at
December 31, 2008.
Many of our lending relationships contain funded and unfunded ele-
ments. The funded portion is reflected on our balance sheet. For lending
relationships carried at historical cost, the unfunded component of these
commitments is not recorded on our balance sheet until a draw is made
under the credit facility; however, a reserve is established for probable
losses. For lending commitments for which we have elected to account
for under SFAS 159, the fair value of the commitment is recorded in
accrued expenses and other liabilities.
For more information on these commitments and guarantees, includ-
ing equity commitments, see Note 13 – Commitments and Contingencies
to the Consolidated Financial Statements. For more information on the
adoption of SFAS 159, see Note 19 – Fair Value Disclosures to the
Consolidated Financial Statements.
We enter into commitments to extend credit such as loan commit-
ments, SBLCs and commercial letters of credit to meet the financing
needs of our customers. For a summary of the total unfunded, or
off-balance sheet, credit extension commitment amounts by expiration
date, see the table in Note 13 – Commitments and Contingencies to the
Consolidated Financial Statements.
Other Commitments
We provided support to cash funds managed within GWIM by purchasing
certain assets at fair value and by committing to provide a limited amount
of capital to the funds. For more information, see Note 13 – Commit-
ments and Contingencies to the Consolidated Financial Statements.
Fair Values of Level 3 Assets and Liabilities
Financial assets and liabilities whose values are based on prices or valu-
ation techniques that require inputs that are both unobservable and are
significant to the overall fair value measurement are classified as Level 3
under the fair value hierarchy established in SFAS 157. The Level 3 finan-
cial assets and liabilities include private equity investments, consumer
MSRs, ABS, highly structured, complex or long-dated derivative contracts
and certain CDOs, for which there is not an active market for identical
assets from which to determine fair value or where sufficient, current
market information about similar assets to use as observable, corrobo-
rated data for all significant inputs into a valuation model is not available.
In these cases, the fair values of these Level 3 financial assets and
liabilities are determined using pricing models, discounted cash flow
methodologies, a net asset value approach for certain structured secu-
rities, or similar techniques, for which the determination of fair value
requires significant management judgment or estimation.
Valuations of products using models or other techniques are sensitive
to assumptions used for the significant inputs. Where market data is
available, the inputs used for valuation reflect that information as of our
valuation date. Inputs to valuation models are considered unobservable if
they are supported by little or no market activity. In periods of extreme
volatility, lessened liquidity or in illiquid markets, there may be more
variability in market pricing or a lack of market data to use in the valu-
ation process. An illiquid market is one in which little or no observable
activity has occurred or one that lacks willing buyers or willing sellers. Fair
value adjustments include adjustments for counterparties’ credit risk as
well as our own credit risk and liquidity as appropriate, to determine a fair
value measurement. Judgment is then applied in formulating those
inputs. Our valuation risk, however, is mitigated through valuation adjust-
ments for particular inputs, performance of stress testing of those inputs
to understand the impact that varying assumptions may have on the valu-
ation and other review processes performed to ensure appropriate valu-
ation.
For example, at December 31, 2008, classified within Level 3 are
$2.4 billion of AFS debt securities, $887 million of trading account
assets and $934 million of net derivative assets associated with our CDO
exposure. Substantially all of these AFS debt securities were acquired as
a result of our liquidity obligations to certain CDOs. For more information
regarding our CDO exposure, the types of assets underlying these
exposures (e.g., percentage of subprime assets and vintages) and related
valuation techniques see our CDO exposure discussion on page 41.
Consumer MSRs are also included in Level 3 assets as valuing these
MSRs requires significant management judgment and estimation. The
Corporation uses an option-adjusted spread (OAS) valuation approach to
determine the fair value of MSRs which factors in prepayment risk. This
approach consists of projecting servicing cash flows under multiple inter-
Table 9 Long-term Debt and Other Obligations
December 31, 2008
(Dollars in millions)
Due in 1
year or less
Due after 1
year through
3 years
Due after 3
years through
5 years
Due after
5 years Total
Long-term debt and capital leases
$42,882
$76,433 $49,471 $ 99,506 $268,292
Purchase obligations
(1)
19,326
7,743 1,198 144 28,411
Operating lease obligations
2,316
3,829 2,701 8,320 17,166
Other long-term liabilities
395
779 516 532 2,222
Total long-term debt and other obligations
$64,919
$88,784 $53,886 $108,502 $316,091
(1) Obligations that are legally binding agreements whereby we agree to purchase products or services with a specific minimum quantity defined at a fixed, minimum or variable price over a specified period of time are
defined as purchase obligations.
52
Bank of America 2008