Bank of America 2008 Annual Report Download - page 30
Download and view the complete annual report
Please find page 30 of the 2008 Bank of America annual report below. You can navigate through the pages in the report by either clicking on the pages listed below, or by using the keyword search tool below to find specific information within the annual report.-
 1
1 -
2
-
3
-
4
-
5
-
6
-
7
-
8
-
9
-
10
-
11
-
12
-
13
-
14
-
15
-
16
-
17
-
18
-
19
-
 20
20 -
 21
21 -
 22
22 -
 23
23 -
 24
24 -
 25
25 -
 26
26 -
 27
27 -
 28
28 -
 29
29 -
 30
30 -
 31
31 -
 32
32 -
 33
33 -
 34
34 -
 35
35 -
 36
36 -
 37
37 -
 38
38 -
 39
39 -
 40
40 -
41
-
42
-
43
-
44
-
45
-
46
-
47
-
48
-
49
-
50
-
51
-
52
-
53
-
54
-
55
-
56
-
57
-
58
-
59
-
60
-
61
-
62
-
63
-
64
-
65
-
66
-
67
-
68
-
69
-
70
-
71
-
72
-
73
-
74
-
75
-
76
-
77
-
78
-
79
-
80
-
81
-
82
-
83
-
84
-
85
-
86
-
87
-
88
-
89
-
90
-
91
-
92
-
93
-
94
-
95
-
96
-
97
-
98
-
99
-
100
-
101
-
102
-
103
-
104
-
105
-
106
-
107
-
108
-
109
-
110
-
111
-
112
-
113
-
114
-
115
-
116
-
117
-
118
-
119
-
120
-
121
-
122
-
123
-
124
-
125
-
126
-
127
-
128
-
129
-
130
-
131
-
132
-
133
-
134
-
135
-
136
-
137
-
138
-
139
-
140
-
141
-
142
-
143
-
144
-
145
-
146
-
147
-
148
-
149
-
150
-
151
-
152
-
153
-
154
-
155
-
156
-
157
-
158
-
159
-
160
-
161
-
162
-
163
-
164
-
165
-
166
-
167
-
168
-
169
-
170
-
171
-
172
-
173
-
174
-
175
-
176
-
177
-
178
-
179
-
180
-
181
-
182
-
183
-
184
-
185
-
186
-
187
-
188
-
189
-
190
-
191
-
192
-
193
-
194
-
195
 |
 |

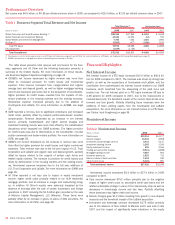
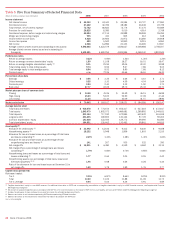
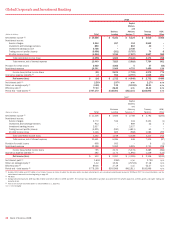
Table 5 Five Year Summary of Selected Financial Data
(Dollars in millions, except per share information) 2008 2007 2006 2005 2004
Income statement
Net interest income
$ 45,360
$ 34,441 $ 34,594 $ 30,737 $ 27,960
Noninterest income
27,422
32,392 38,182 26,438 22,729
Total revenue, net of interest expense
72,782
66,833 72,776 57,175 50,689
Provision for credit losses
26,825
8,385 5,010 4,014 2,769
Noninterest expense, before merger and restructuring charges
40,594
37,114 34,988 28,269 26,394
Merger and restructuring charges
935
410 805 412 618
Income before income taxes
4,428
20,924 31,973 24,480 20,908
Income tax expense
420
5,942 10,840 8,015 6,961
Net income
4,008
14,982 21,133 16,465 13,947
Average common shares issued and outstanding (in thousands)
4,592,085
4,423,579 4,526,637 4,008,688 3,758,507
Average diluted common shares issued and outstanding (in
thousands)
4,612,491
4,480,254 4,595,896 4,068,140 3,823,943
Performance ratios
Return on average assets
0.22%
0.94% 1.44% 1.30% 1.34%
Return on average common shareholders’ equity
1.80
11.08 16.27 16.51 16.47
Return on average tangible shareholders’ equity
(1)
5.31
25.94 39.06 32.30 30.98
Total ending equity to total ending assets
9.74
8.56 9.27 7.86 9.03
Total average equity to total average assets
8.94
8.53 8.90 7.86 8.12
Dividend payout
n/m
72.26 45.66 46.61 46.31
Per common share data
Earnings
$ 0.56
$ 3.35 $ 4.66 $ 4.10 $ 3.71
Diluted earnings
0.55
3.30 4.59 4.04 3.64
Dividends paid
2.24
2.40 2.12 1.90 1.70
Book value
27.77
32.09 29.70 25.32 24.70
Market price per share of common stock
Closing
$ 14.08
$ 41.26 $ 53.39 $ 46.15 $ 46.99
High closing
45.03
54.05 54.90 47.08 47.44
Low closing
11.25
41.10 43.09 41.57 38.96
Market capitalization
$ 70,645
$ 183,107 $ 238,021 $ 184,586 $ 190,147
Average balance sheet
Total loans and leases
$ 910,878
$ 776,154 $ 652,417 $ 537,218 $ 472,617
Total assets
1,843,979
1,602,073 1,466,681 1,269,892 1,044,631
Total deposits
831,144
717,182 672,995 632,432 551,559
Long-term debt
231,235
169,855 130,124 97,709 92,303
Common shareholders’ equity
141,638
133,555 129,773 99,590 84,584
Total shareholders’ equity
164,831
136,662 130,463 99,861 84,815
Asset quality (2)
Allowance for credit losses
(3)
$ 23,492
$ 12,106 $ 9,413 $ 8,440 $ 9,028
Nonperforming assets
(4)
18,232
5,948 1,856 1,603 2,315
Allowance for loan and lease losses as a percentage of total loans
and leases outstanding
(5)
2.49%
1.33% 1.28% 1.40% 1.65%
Allowance for loan and lease losses as a percentage of total
nonperforming loans and leases
(5)
141
207 505 532 390
Net charge-offs
$ 16,231
$ 6,480 $ 4,539 $ 4,562 $ 3,113
Net charge-offs as a percentage of average loans and leases
outstanding
(5)
1.79%
0.84% 0.70% 0.85% 0.66%
Nonperforming loans and leases as a percentage of total loans and
leases outstanding
(5)
1.77
0.64 0.25 0.26 0.42
Nonperforming assets as a percentage of total loans, leases and
foreclosed properties
(4, 5)
1.96
0.68 0.26 0.28 0.44
Ratio of the allowance for loan and lease losses at December 31 to
net charge-offs
1.42
1.79 1.99 1.76 2.77
Capital ratios (period end)
Risk-based capital:
Tier 1
9.15%
6.87% 8.64% 8.25% 8.20%
Total
13.00
11.02 11.88 11.08 11.73
Tier 1 Leverage
6.44
5.04 6.36 5.91 5.89
(1) Tangible shareholders’ equity is a non-GAAP measure. For additional information on ROTE and a corresponding reconciliation of tangible shareholders’ equity to a GAAP financial measure, see Supplemental Financial
Data beginning on page 29.
(2) We account for acquired impaired loans in accordance with SOP 03-3. For more information on the impact of SOP 03-3 on asset quality, see Consumer Portfolio Credit Risk Management beginning on page 62.
(3) Includes the allowance for loan and lease losses and the reserve for unfunded lending commitments.
(4) Balances and ratios do not include nonperforming LHFS and nonperforming AFS debt securities.
(5) Balances and ratios do not include loans measured at fair value in accordance with SFAS 159.
n/m = not meaningful
28
Bank of America 2008