Bank of America 2008 Annual Report Download - page 108
Download and view the complete annual report
Please find page 108 of the 2008 Bank of America annual report below. You can navigate through the pages in the report by either clicking on the pages listed below, or by using the keyword search tool below to find specific information within the annual report.-
 1
1 -
2
-
3
-
4
-
5
-
6
-
7
-
8
-
9
-
10
-
11
-
12
-
13
-
14
-
15
-
16
-
17
-
18
-
19
-
20
-
21
-
22
-
23
-
24
-
25
-
26
-
27
-
28
-
29
-
30
-
31
-
32
-
33
-
34
-
35
-
36
-
37
-
38
-
39
-
40
-
41
-
42
-
43
-
44
-
45
-
46
-
47
-
48
-
49
-
50
-
51
-
52
-
53
-
54
-
55
-
56
-
57
-
58
-
59
-
60
-
61
-
62
-
63
-
64
-
65
-
66
-
67
-
68
-
69
-
70
-
71
-
72
-
73
-
74
-
75
-
76
-
77
-
78
-
79
-
80
-
81
-
82
-
83
-
84
-
85
-
86
-
87
-
88
-
89
-
90
-
91
-
92
-
93
-
94
-
95
-
96
-
97
-
 98
98 -
 99
99 -
 100
100 -
 101
101 -
 102
102 -
 103
103 -
 104
104 -
 105
105 -
 106
106 -
 107
107 -
 108
108 -
 109
109 -
 110
110 -
 111
111 -
 112
112 -
 113
113 -
 114
114 -
 115
115 -
 116
116 -
 117
117 -
 118
118 -
119
-
120
-
121
-
122
-
123
-
124
-
125
-
126
-
127
-
128
-
129
-
130
-
131
-
132
-
133
-
134
-
135
-
136
-
137
-
138
-
139
-
140
-
141
-
142
-
143
-
144
-
145
-
146
-
147
-
148
-
149
-
150
-
151
-
152
-
153
-
154
-
155
-
156
-
157
-
158
-
159
-
160
-
161
-
162
-
163
-
164
-
165
-
166
-
167
-
168
-
169
-
170
-
171
-
172
-
173
-
174
-
175
-
176
-
177
-
178
-
179
-
180
-
181
-
182
-
183
-
184
-
185
-
186
-
187
-
188
-
189
-
190
-
191
-
192
-
193
-
194
-
195
 |
 |

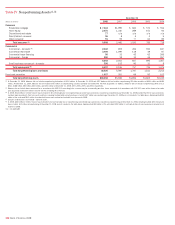
Table VIII Selected Loan Maturity Data (1, 2)
December 31, 2008
(Dollars in millions)
Due in
One Year
or Less
Due After
One Year
Through
Five Years
Due After
Five
Years Total
Commercial – domestic
$ 79,299
$101,998 $41,431 $222,728
Commercial real estate – domestic
29,100
30,298 4,527 63,925
Foreign and other
(3)
25,268
10,581 273 36,122
Total selected loans
$133,667
$142,877 $46,231 $322,775
Percent of total
41.4%
44.3% 14.3% 100.0%
Sensitivity of selected loans to changes in interest rates for loans due after one year:
Fixed interest rates $ 11,978 $23,888
Floating or adjustable interest rates 130,899 22,343
Total $142,877 $46,231
(1) Loan maturities are based on the remaining maturities under contractual terms.
(2) Includes loans measured at fair value in accordance with SFAS 159.
(3) Loan maturities include direct/indirect consumer, other consumer, commercial real estate and commercial – foreign loans.
Table IX Short-term Borrowings
2008 2007 2006
(Dollars in millions) Amount Rate Amount Rate Amount Rate
Federal funds purchased
At December 31
$ 14,432
0.11% $ 14,187 4.15% $ 12,232 5.35%
Average during year
8,969
1.67 7,595 4.84 5,292 5.11
Maximum month-end balance during year
18,788
–14,187 – 12,232 –
Securities sold under agreements to repurchase
At December 31
192,166
0.84 207,248 4.63 205,295 4.94
Average during year
264,012
2.54 245,886 5.21 281,611 4.66
Maximum month-end balance during year
295,537
–277,196 – 312,955 –
Commercial paper
At December 31
37,986
1.80 55,596 4.85 41,223 5.34
Average during year
57,337
3.09 57,712 5.03 33,942 5.15
Maximum month-end balance during year
65,399
–69,367 – 42,511 –
Other short-term borrowings
At December 31
120,070
2.07 135,493 4.95 100,077 5.43
Average during year
125,392
2.99 113,621 5.18 90,287 5.21
Maximum month-end balance during year
160,150
–142,047 – 104,555 –
106
Bank of America 2008