Bank of America 2008 Annual Report Download - page 109
Download and view the complete annual report
Please find page 109 of the 2008 Bank of America annual report below. You can navigate through the pages in the report by either clicking on the pages listed below, or by using the keyword search tool below to find specific information within the annual report.-
 1
1 -
2
-
3
-
4
-
5
-
6
-
7
-
8
-
9
-
10
-
11
-
12
-
13
-
14
-
15
-
16
-
17
-
18
-
19
-
20
-
21
-
22
-
23
-
24
-
25
-
26
-
27
-
28
-
29
-
30
-
31
-
32
-
33
-
34
-
35
-
36
-
37
-
38
-
39
-
40
-
41
-
42
-
43
-
44
-
45
-
46
-
47
-
48
-
49
-
50
-
51
-
52
-
53
-
54
-
55
-
56
-
57
-
58
-
59
-
60
-
61
-
62
-
63
-
64
-
65
-
66
-
67
-
68
-
69
-
70
-
71
-
72
-
73
-
74
-
75
-
76
-
77
-
78
-
79
-
80
-
81
-
82
-
83
-
84
-
85
-
86
-
87
-
88
-
89
-
90
-
91
-
92
-
93
-
94
-
95
-
96
-
97
-
98
-
 99
99 -
 100
100 -
 101
101 -
 102
102 -
 103
103 -
 104
104 -
 105
105 -
 106
106 -
 107
107 -
 108
108 -
 109
109 -
 110
110 -
 111
111 -
 112
112 -
 113
113 -
 114
114 -
 115
115 -
 116
116 -
 117
117 -
 118
118 -
 119
119 -
120
-
121
-
122
-
123
-
124
-
125
-
126
-
127
-
128
-
129
-
130
-
131
-
132
-
133
-
134
-
135
-
136
-
137
-
138
-
139
-
140
-
141
-
142
-
143
-
144
-
145
-
146
-
147
-
148
-
149
-
150
-
151
-
152
-
153
-
154
-
155
-
156
-
157
-
158
-
159
-
160
-
161
-
162
-
163
-
164
-
165
-
166
-
167
-
168
-
169
-
170
-
171
-
172
-
173
-
174
-
175
-
176
-
177
-
178
-
179
-
180
-
181
-
182
-
183
-
184
-
185
-
186
-
187
-
188
-
189
-
190
-
191
-
192
-
193
-
194
-
195
 |
 |

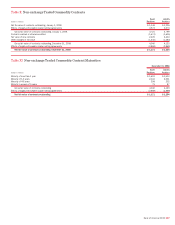
Table X Non-exchange Traded Commodity Contracts
(Dollars in millions)
Asset
Positions
Liability
Positions
Net fair value of contracts outstanding, January 1, 2008 $ 1,148 $ 1,226
Effects of legally enforceable master netting agreements 3,573 3,573
Gross fair value of contracts outstanding, January 1, 2008 4,721 4,799
Contracts realized or otherwise settled (1,674) (1,605)
Fair value of new contracts 2,435 2,413
Other changes in fair value (1,442) (1,484)
Gross fair value of contracts outstanding, December 31, 2008 4,040 4,123
Effects of legally enforceable master netting agreements (2,869) (2,869)
Net fair value of contracts outstanding, December 31, 2008
$ 1,171 $ 1,254
Table XI Non-exchange Traded Commodity Contract Maturities
December 31, 2008
(Dollars in millions)
Asset
Positions
Liability
Positions
Maturity of less than 1 year $ 1,623 $ 1,503
Maturity of 1-3 years 2,134 2,331
Maturity of 4-5 years 208 202
Maturity in excess of 5 years 75 87
Gross fair value of contracts outstanding 4,040 4,123
Effects of legally enforceable master netting agreements (2,869) (2,869)
Net fair value of contracts outstanding
$ 1,171 $ 1,254
Bank of America 2008
107