Bank of America 2008 Annual Report Download - page 36
Download and view the complete annual report
Please find page 36 of the 2008 Bank of America annual report below. You can navigate through the pages in the report by either clicking on the pages listed below, or by using the keyword search tool below to find specific information within the annual report.-
 1
1 -
2
-
3
-
4
-
5
-
6
-
7
-
8
-
9
-
10
-
11
-
12
-
13
-
14
-
15
-
16
-
17
-
18
-
19
-
20
-
21
-
22
-
23
-
24
-
25
-
 26
26 -
 27
27 -
 28
28 -
 29
29 -
 30
30 -
 31
31 -
 32
32 -
 33
33 -
 34
34 -
 35
35 -
 36
36 -
 37
37 -
 38
38 -
 39
39 -
 40
40 -
 41
41 -
 42
42 -
 43
43 -
 44
44 -
 45
45 -
 46
46 -
47
-
48
-
49
-
50
-
51
-
52
-
53
-
54
-
55
-
56
-
57
-
58
-
59
-
60
-
61
-
62
-
63
-
64
-
65
-
66
-
67
-
68
-
69
-
70
-
71
-
72
-
73
-
74
-
75
-
76
-
77
-
78
-
79
-
80
-
81
-
82
-
83
-
84
-
85
-
86
-
87
-
88
-
89
-
90
-
91
-
92
-
93
-
94
-
95
-
96
-
97
-
98
-
99
-
100
-
101
-
102
-
103
-
104
-
105
-
106
-
107
-
108
-
109
-
110
-
111
-
112
-
113
-
114
-
115
-
116
-
117
-
118
-
119
-
120
-
121
-
122
-
123
-
124
-
125
-
126
-
127
-
128
-
129
-
130
-
131
-
132
-
133
-
134
-
135
-
136
-
137
-
138
-
139
-
140
-
141
-
142
-
143
-
144
-
145
-
146
-
147
-
148
-
149
-
150
-
151
-
152
-
153
-
154
-
155
-
156
-
157
-
158
-
159
-
160
-
161
-
162
-
163
-
164
-
165
-
166
-
167
-
168
-
169
-
170
-
171
-
172
-
173
-
174
-
175
-
176
-
177
-
178
-
179
-
180
-
181
-
182
-
183
-
184
-
185
-
186
-
187
-
188
-
189
-
190
-
191
-
192
-
193
-
194
-
195
 |
 |

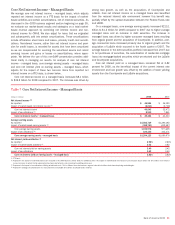
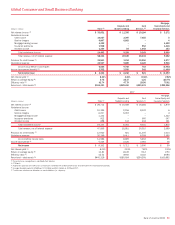
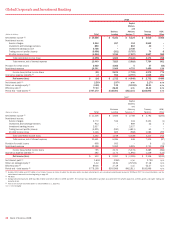
December 31 Average Balance
(Dollars in millions) 2008 2007 2008 2007
Total loans and leases
$365,198
$325,759
$350,264
$294,030
Total earning assets
(1)
434,568
381,520
401,671
357,639
Total assets
(1)
511,401
445,319
471,223
409,999
Total deposits
393,165
346,908
370,961
330,661
(1) Total earning assets and total assets include asset allocations to match liabilities (i.e., deposits).
The strategy for GCSBB is to attract, retain and deepen customer rela-
tionships. We execute this strategy through our ability to offer a wide
range of products and services through a franchise that stretches coast
to coast through 32 states and the District of Columbia. We also provide
credit card products to customers in Canada, Ireland, Spain and the
United Kingdom. In the U.S., we serve approximately 59 million consumer
and small business relationships utilizing our network of 6,139 banking
centers, 18,685 domestic branded ATMs, and telephone and Internet
channels. GCSBB is made up of three businesses: Deposits and Student
Lending,Card Services and MHEIS.GCSBB, specifically the Card Services
business, is presented on a managed basis. For a reconciliation of
managed GCSBB to held GCSBB, see Note 22 – Business Segment
Information to the Consolidated Financial Statements.
Net income decreased $5.1 billion, or 55 percent, to $4.2 billion
compared to 2007 as growth in noninterest income and net interest
income was more than offset by higher provision for credit losses and an
increase in noninterest expense.
Net interest income increased $5.1 billion, or 18 percent, to $33.9
billion due to higher margin on ALM activities and the impact of the Coun-
trywide and LaSalle acquisitions. In addition, average loans and leases,
and average deposits increased $56.2 billion and $40.3 billion, or 19
percent and 12 percent. Noninterest income increased $5.4 billion, or 28
percent, due to increased mortgage banking income and insurance pre-
miums primarily as a result of the Countrywide acquisition, and higher
service charges. In addition, noninterest income benefited from the $388
million gain from the Visa IPO transactions and $283 million gain on the
sale of a card portfolio.
Provision for credit losses increased $13.9 billion to $26.8 billion
compared to $12.9 billion in 2007, driven by increases of $8.2 billion
and $5.3 billion in Card Services and MHEIS. For further discussion
related to Card Services and MHEIS, see their respective discussions
beginning on pages 35 and 36.
Noninterest expense increased $4.6 billion, or 23 percent, to $24.9
billion, primarily driven by the Countrywide and LaSalle acquisitions.
Deposits and Student Lending
Deposits and Student Lending includes the results of consumer deposits
activities which include a comprehensive range of products to consumers
and small businesses. In addition, Deposits and Student Lending
includes our student lending and small business banking results, exclud-
ing business card, and the net effect of our ALM activities. Debit Card
results are also included in Deposits and Student Lending.
Our deposit products include traditional savings accounts, money
market savings accounts, CDs and IRAs, and noninterest- and interest-
bearing checking accounts. Deposit products provide a relatively stable
source of funding and liquidity. We earn net interest spread revenues
from investing this liquidity in earning assets through client-facing lending
and ALM activities. The revenue is allocated to the deposit products using
our funds transfer pricing process which takes into account the interest
rates and maturity characteristics of the deposits. Deposits also generate
fees such as account service fees, non-sufficient fund fees, overdraft
charges and ATM fees, while debit cards generate merchant interchange
fees based on purchase volume.
We added 2.2 million net new retail checking accounts in 2008.
These additions resulted from continued improvement in sales and serv-
ice results in the Banking Center Channel and Online, and the success of
new Affinity relationships and products such as Keep the Change
TM
. Dur-
ing 2008, our active online banking customer base grew to 28.9 million
subscribers, an increase of 5.1 million net subscribers from 2007. In
addition, our active bill pay users paid $309.7 billion worth of bills online
during 2008.
We continue to migrate qualifying affluent customers and their related
deposit balances to GWIM. In 2008 and 2007, a total of $20.5 billion
and $11.4 billion of deposits were migrated from Deposits and Student
Lending to Premier Banking and Investments (PB&I) within GWIM. The
increase was mainly due to the initial migration of legacy LaSalle
accounts and the acceleration of moving qualified clients into PB&I as
part of our growth initiatives for our mass affluent and retirement custom-
ers. After migration, the associated net interest income, service charges
and noninterest expense are recorded in GWIM.
Net income increased $497 million, or nine percent, to $6.2 billion
compared to 2007 driven by higher noninterest income and net interest
income partially offset by increases in noninterest expense and provision
for credit losses.
Net interest income increased $846 million, or eight percent, driven
by a higher contribution from our ALM activities and growth in average
deposits partially offset by the impact of competitive deposit pricing.
Average deposits grew $34.2 billion, or 11 percent, due to organic
growth, including customers’ flight-to-safety, as well as the acquisitions of
Countrywide and LaSalle. Organic growth was partially offset by the migra-
tion of customer relationships and related deposit balances to GWIM.
Noninterest income increased $952 million, or 11 percent, to $9.3
billion driven by higher service charges of $800 million, or 13 percent,
primarily as a result of increased volume, new demand deposit account
growth and the addition of LaSalle. Additionally, debit card revenue growth
of $241 million, or 11 percent, was due to new account and card growth,
increased usage and the addition of LaSalle.
Provision for credit losses increased $413 million, or 69 percent, to
$1.0 billion principally driven by deterioration in the small business lend-
ing portfolio due to the impacts of a slowing economy and seasoning of
the portfolio reflective of growth. In addition, the provision for credit
losses increased due to losses on overdraft accounts.
Noninterest expense increased $458 million, or five percent, to $9.9
billion compared to 2007, primarily due to the acquisitions of LaSalle and
Countrywide, combined with an increase in accounts and transaction
volumes.
34
Bank of America 2008