Bank of America 2008 Annual Report Download - page 89
Download and view the complete annual report
Please find page 89 of the 2008 Bank of America annual report below. You can navigate through the pages in the report by either clicking on the pages listed below, or by using the keyword search tool below to find specific information within the annual report.-
 1
1 -
2
-
3
-
4
-
5
-
6
-
7
-
8
-
9
-
10
-
11
-
12
-
13
-
14
-
15
-
16
-
17
-
18
-
19
-
20
-
21
-
22
-
23
-
24
-
25
-
26
-
27
-
28
-
29
-
30
-
31
-
32
-
33
-
34
-
35
-
36
-
37
-
38
-
39
-
40
-
41
-
42
-
43
-
44
-
45
-
46
-
47
-
48
-
49
-
50
-
51
-
52
-
53
-
54
-
55
-
56
-
57
-
58
-
59
-
60
-
61
-
62
-
63
-
64
-
65
-
66
-
67
-
68
-
69
-
70
-
71
-
72
-
73
-
74
-
75
-
76
-
77
-
78
-
 79
79 -
 80
80 -
 81
81 -
 82
82 -
 83
83 -
 84
84 -
 85
85 -
 86
86 -
 87
87 -
 88
88 -
 89
89 -
 90
90 -
 91
91 -
 92
92 -
 93
93 -
 94
94 -
 95
95 -
 96
96 -
 97
97 -
 98
98 -
 99
99 -
100
-
101
-
102
-
103
-
104
-
105
-
106
-
107
-
108
-
109
-
110
-
111
-
112
-
113
-
114
-
115
-
116
-
117
-
118
-
119
-
120
-
121
-
122
-
123
-
124
-
125
-
126
-
127
-
128
-
129
-
130
-
131
-
132
-
133
-
134
-
135
-
136
-
137
-
138
-
139
-
140
-
141
-
142
-
143
-
144
-
145
-
146
-
147
-
148
-
149
-
150
-
151
-
152
-
153
-
154
-
155
-
156
-
157
-
158
-
159
-
160
-
161
-
162
-
163
-
164
-
165
-
166
-
167
-
168
-
169
-
170
-
171
-
172
-
173
-
174
-
175
-
176
-
177
-
178
-
179
-
180
-
181
-
182
-
183
-
184
-
185
-
186
-
187
-
188
-
189
-
190
-
191
-
192
-
193
-
194
-
195
 |
 |

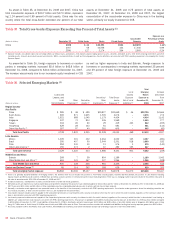
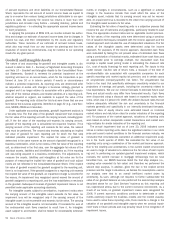
Trading Risk and Return
Daily Trading-related Revenue and VAR
-300
-250
-200
-150
-100
-50
0
50
100
150
200
250
(Dollars in millions)
Daily
Trading-
related
Revenue
VAR
12/31/2007 3/31/2008 6/30/2008 9/30/2008 12/31/2008
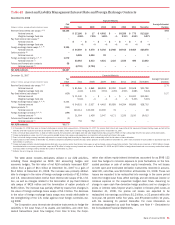
Table 39 Trading Activities Market Risk VAR
12 Months Ended December 31
2008 2007
VAR VAR
(1)
(Dollars in millions) Average High
(2)
Low
(2)
Average High
(2)
Low
(2)
Foreign exchange
$ 7.7 $ 11.7 $ 5.0
$ 7.2 $25.3 $ 3.8
Interest rate
28.9 68.3 12.4
13.9 31.9 6.6
Credit
84.6 185.2 44.1
39.5 69.9 23.4
Real estate/mortgage
22.7 43.1 12.8
14.1 23.5 5.7
Equities
28.0 63.9 15.5
24.6 45.8 9.6
Commodities
8.2 17.7 2.4
7.2 10.7 3.7
Portfolio diversification
(69.4) – –
(53.9) – –
Total market-based trading portfolio (3)
$110.7 $255.7 $64.1
$ 52.6 $91.5 $32.9
(1) Excludes our discrete writedowns on super senior CDO exposure.
(2) The high and low for the total portfolio may not equal the sum of the individual components as the highs or lows of the individual portfolios may have occurred on different trading days.
(3) The table above does not include credit protection purchased to manage our counterparty credit risk.
Table 39 presents average, high and low daily trading VAR for the 12
months ended December 31, 2008 and 2007.
The increases in average VAR during 2008 as compared to 2007 were
due to the rise in market volatility that started during the second half of
2007 and accelerated into the fourth quarter of 2008. As previously dis-
cussed, we updated our VAR model during the first quarter of 2008 and
as the increased market volatility was incorporated into the historical
price data, the level of VAR increased substantially.
Counterparty credit risk is an adjustment to the mark-to-market value
of our derivative exposures reflecting the impact of the credit quality of
counterparties on our derivative assets. Since counterparty credit
exposure is not included in the VAR component of the regulatory capital
allocation, we do not include it in our trading VAR, and it is therefore not
included in the daily trading-related revenue illustrated in our histogram
and used for backtesting. At December 31, 2008 and 2007, the VAR for
counterparty credit risk, together with associated hedges that are marked
to market, was $86 million and $13 million.
Stress Testing
Because the very nature of a VAR model suggests results can exceed our
estimates, we also “stress test” our portfolio. Stress testing estimates
the value change in our trading portfolio that may result from abnormal
market movements. Various types of stress tests are run regularly
against the overall trading portfolio and individual businesses. Historical
scenarios simulate the impact of price changes which occurred during a
set of extended historical market events. The results of these scenarios
are reported daily to management. During the 12 months ended
December 31, 2008, the largest daily losses among the historical scenar-
ios ranged from $21 million to $999 million. This can be compared with
losses from $9 million to $529 million for the historical scenarios during
the 12 months ended December 31, 2007. The increase in historical
stress values are primarily associated with the introduction of a new
scenario to reflect the ongoing credit crisis related to the credit market
disruptions that occurred during the past 12-15 months. Hypothetical
scenarios simulate the anticipated shocks from predefined market stress
events. These stress events include shocks to underlying market risk
variables which may be well beyond the shocks found in the historical
data used to calculate the VAR. In addition to the value afforded by the
results themselves this information provides senior management with a
clear picture of the trend of risk being taken given the relatively static
nature of the shocks applied. During the 12 months ended December 31,
2008, the largest losses among the hypothetical scenarios ranged from
Bank of America 2008
87