Bank of America 2008 Annual Report Download - page 188
Download and view the complete annual report
Please find page 188 of the 2008 Bank of America annual report below. You can navigate through the pages in the report by either clicking on the pages listed below, or by using the keyword search tool below to find specific information within the annual report.-
 1
1 -
2
-
3
-
4
-
5
-
6
-
7
-
8
-
9
-
10
-
11
-
12
-
13
-
14
-
15
-
16
-
17
-
18
-
19
-
20
-
21
-
22
-
23
-
24
-
25
-
26
-
27
-
28
-
29
-
30
-
31
-
32
-
33
-
34
-
35
-
36
-
37
-
38
-
39
-
40
-
41
-
42
-
43
-
44
-
45
-
46
-
47
-
48
-
49
-
50
-
51
-
52
-
53
-
54
-
55
-
56
-
57
-
58
-
59
-
60
-
61
-
62
-
63
-
64
-
65
-
66
-
67
-
68
-
69
-
70
-
71
-
72
-
73
-
74
-
75
-
76
-
77
-
78
-
79
-
80
-
81
-
82
-
83
-
84
-
85
-
86
-
87
-
88
-
89
-
90
-
91
-
92
-
93
-
94
-
95
-
96
-
97
-
98
-
99
-
100
-
101
-
102
-
103
-
104
-
105
-
106
-
107
-
108
-
109
-
110
-
111
-
112
-
113
-
114
-
115
-
116
-
117
-
118
-
119
-
120
-
121
-
122
-
123
-
124
-
125
-
126
-
127
-
128
-
129
-
130
-
131
-
132
-
133
-
134
-
135
-
136
-
137
-
138
-
139
-
140
-
141
-
142
-
143
-
144
-
145
-
146
-
147
-
148
-
149
-
150
-
151
-
152
-
153
-
154
-
155
-
156
-
157
-
158
-
159
-
160
-
161
-
162
-
163
-
164
-
165
-
166
-
167
-
168
-
169
-
170
-
171
-
172
-
173
-
174
-
175
-
176
-
177
-
 178
178 -
 179
179 -
 180
180 -
 181
181 -
 182
182 -
 183
183 -
 184
184 -
 185
185 -
 186
186 -
 187
187 -
 188
188 -
 189
189 -
 190
190 -
 191
191 -
 192
192 -
 193
193 -
 194
194 -
 195
195
 |
 |

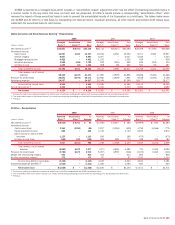
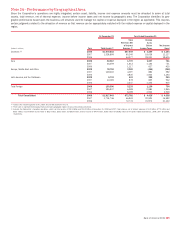
The following tables present reconciliations of the three business segments’ (GCSBB,GCIB and GWIM) total revenue, net of interest expense, on a
FTE basis and net income to the Consolidated Statement of Income, and total assets to the Consolidated Balance Sheet. The adjustments presented
in the table below include consolidated income and expense amounts not specifically allocated to individual business segments.
Year Ended December 31
(Dollars in millions)
2008
2007 2006
Segments’ total revenue, net of interest expense
(1)
$79,569
$69,059 $73,269
Adjustments:
ALM activities
1,867
66 (936)
Equity investment income
265
3,745 2,872
Liquidating businesses
256
1,060 3,013
FTE basis adjustment
(1,194)
(1,749) (1,224)
Managed securitization impact to total revenue, net of interest expense
(6,670)
(4,959) (3,362)
Other
(1,311)
(389) (856)
Consolidated revenue, net of interest expense
$72,782
$66,833 $72,776
Segments’ net income
$ 5,636
$11,832 $19,562
Adjustments, net of taxes:
ALM activities
(1,015)
(241) (816)
Equity investment income
167
2,359 1,809
Liquidating businesses
86
613 1,276
Merger and restructuring charges
(630)
(258) (507)
Other
(236)
677 (191)
Consolidated net income
$ 4,008
$14,982 $21,133
(1) FTE basis
December 31
(Dollars in millions)
2008
2007
Segments’ total assets
$1,406,565
$1,379,160
Adjustments:
ALM activities, including securities portfolio
553,730
452,626
Equity investments
28,839
28,358
Liquidating businesses
3,172
4,608
Elimination of segment excess asset allocations to match liabilities
(100,611)
(104,118)
Elimination of managed securitized loans
(1)
(100,960)
(102,967)
Other
27,208
58,079
Consolidated total assets
$1,817,943
$1,715,746
(1) Represents GCSBB’s securitized loans.
186
Bank of America 2008