Bank of America 2008 Annual Report Download - page 70
Download and view the complete annual report
Please find page 70 of the 2008 Bank of America annual report below. You can navigate through the pages in the report by either clicking on the pages listed below, or by using the keyword search tool below to find specific information within the annual report.-
 1
1 -
2
-
3
-
4
-
5
-
6
-
7
-
8
-
9
-
10
-
11
-
12
-
13
-
14
-
15
-
16
-
17
-
18
-
19
-
20
-
21
-
22
-
23
-
24
-
25
-
26
-
27
-
28
-
29
-
30
-
31
-
32
-
33
-
34
-
35
-
36
-
37
-
38
-
39
-
40
-
41
-
42
-
43
-
44
-
45
-
46
-
47
-
48
-
49
-
50
-
51
-
52
-
53
-
54
-
55
-
56
-
57
-
58
-
59
-
 60
60 -
 61
61 -
 62
62 -
 63
63 -
 64
64 -
 65
65 -
 66
66 -
 67
67 -
 68
68 -
 69
69 -
 70
70 -
 71
71 -
 72
72 -
 73
73 -
 74
74 -
 75
75 -
 76
76 -
 77
77 -
 78
78 -
 79
79 -
 80
80 -
81
-
82
-
83
-
84
-
85
-
86
-
87
-
88
-
89
-
90
-
91
-
92
-
93
-
94
-
95
-
96
-
97
-
98
-
99
-
100
-
101
-
102
-
103
-
104
-
105
-
106
-
107
-
108
-
109
-
110
-
111
-
112
-
113
-
114
-
115
-
116
-
117
-
118
-
119
-
120
-
121
-
122
-
123
-
124
-
125
-
126
-
127
-
128
-
129
-
130
-
131
-
132
-
133
-
134
-
135
-
136
-
137
-
138
-
139
-
140
-
141
-
142
-
143
-
144
-
145
-
146
-
147
-
148
-
149
-
150
-
151
-
152
-
153
-
154
-
155
-
156
-
157
-
158
-
159
-
160
-
161
-
162
-
163
-
164
-
165
-
166
-
167
-
168
-
169
-
170
-
171
-
172
-
173
-
174
-
175
-
176
-
177
-
178
-
179
-
180
-
181
-
182
-
183
-
184
-
185
-
186
-
187
-
188
-
189
-
190
-
191
-
192
-
193
-
194
-
195
 |
 |

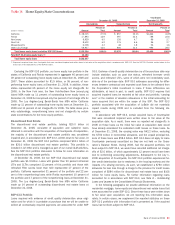
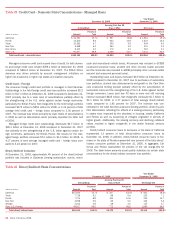
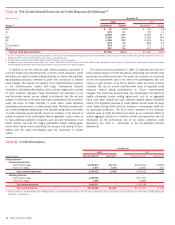
Table 22 Credit Card – Domestic State Concentrations – Managed Basis
December 31, 2008
Year Ended
December 31, 2008
Outstandings
Accruing Past Due 90
Days or More Net Losses
(Dollars in millions) Amount
Percent of
Total Amount
Percent of
Total Amount
Percent of
Total
California $ 24,191 15.7% $ 997 19.8% $ 1,916 19.1%
Florida 13,210 8.6 642 12.8 1,223 12.2
Texas 10,262 6.7 293 5.8 634 6.3
New York 9,368 6.1 263 5.2 531 5.3
New Jersey 6,113 4.0 172 3.4 316 3.1
Other U.S. 91,007 58.9 2,666 53.0 5,434 54.0
Total credit card – domestic loans
$154,151 100.0% $5,033 100.0% $10,054 100.0%
Managed consumer credit card unused lines of credit, for both domes-
tic and foreign credit card, totaled $789.1 billion at December 31, 2008
compared to $846.0 billion at December 31, 2007. The $56.9 billion
decrease was driven primarily by account management initiatives on
higher risk customers in higher risk states and inactive accounts.
Credit Card – Foreign
The consumer foreign credit card portfolio is managed in Card Services.
Outstandings in the held foreign credit card loan portfolio increased $2.2
billion to $17.1 billion at December 31, 2008 compared to December 31,
2007 primarily due to a lower level of securitizations partially offset by
the strengthening of the U.S. dollar against certain foreign currencies,
particularly the British Pound. Net charge-offs for the held foreign portfolio
increased $172 million to $551 million for 2008, or 3.34 percent of total
average held credit card – foreign loans compared to 3.06 percent in
2007. The increase was driven primarily by lower levels of securitizations
in 2008 as well as deterioration which primarily impacted the latter half
of 2008.
Managed foreign credit card outstandings decreased $3.7 billion to
$28.1 billion at December 31, 2008 compared to December 31, 2007
due primarily to the strengthening of the U.S. dollar against certain for-
eign currencies, particularly the British Pound. Net losses for the man-
aged foreign portfolio increased $74 million to $1.3 billion for 2008, or
4.17 percent of total average managed credit card – foreign loans com-
pared to 4.24 percent in 2007.
Direct/Indirect Consumer
At December 31, 2008, approximately 49 percent of the direct/indirect
portfolio was included in Business Lending (automotive, marine, motor-
cycle and recreational vehicle loans), 46 percent was included in GCSBB
(unsecured personal loans, student and other non-real estate secured)
and the remainder was included in GWIM (principally other non-real estate
secured and unsecured personal loans).
Outstanding loans and leases increased $6.9 billion at December 31,
2008 compared to December 31, 2007 due to purchases of automobile
loan portfolios, student loan disbursements and growth in the Card Serv-
ices unsecured lending product partially offset by the securitization of
automobile loans and the strengthening of the U.S. dollar against certain
foreign currencies. Loans past due 90 days or more and still accruing
interest increased $625 million. Net charge-offs increased $1.7 billion to
$3.1 billion for 2008, or 3.77 percent of total average direct/indirect
loans compared to 1.96 percent for 2007. The increase was con-
centrated in the Card Services unsecured lending portfolio, driven by port-
folio deterioration reflecting the effects of a slowing economy particularly
in states most impacted by the slowdown in housing, notably California
and Florida as well as seasoning of vintages originated in periods of
higher growth. Additionally, the slowing economy and declining collateral
values resulted in higher charge-offs in the dealer financial services
portfolio.
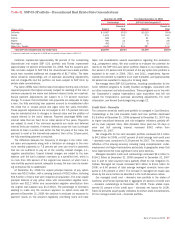
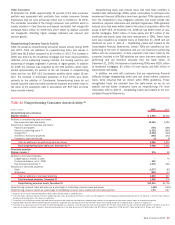
Direct/Indirect consumer loans to borrowers in the state of California
represented 13 percent of total direct/indirect consumer loans at
December 31, 2008. In addition, direct/indirect consumer loans to bor-
rowers in the state of Florida represented nine percent of the total direct/
indirect consumer portfolio at December 31, 2008. In aggregate, Cal-
ifornia and Florida represented 30 percent of the net charge-offs for
2008. The table below presents asset quality indicators by certain state
concentrations for the direct/indirect consumer loan portfolio.
Table 23 Direct/Indirect State Concentrations
December 31, 2008
Year Ended
December 31, 2008
Outstandings
Accruing Past Due 90
Days or More Net Charge-offs
(Dollars in millions) Amount
Percent of
Total Amount
Percent of
Total Amount
Percent of
Total
California $10,555 12.7% $ 247 18.0% $ 601 19.3%
Texas 7,738 9.3 88 6.4 222 7.1
Florida 7,376 8.8 145 10.6 334 10.7
New York 4,938 5.9 69 5.0 162 5.2
Georgia 3,212 3.8 48 3.5 115 3.7
Other U.S./Foreign 49,617 59.5 773 56.5 1,680 54.0
Total direct/indirect loans
$83,436 100.0% $1,370 100.0% $3,114 100.0%
68
Bank of America 2008