Bank of America 2008 Annual Report Download - page 74
Download and view the complete annual report
Please find page 74 of the 2008 Bank of America annual report below. You can navigate through the pages in the report by either clicking on the pages listed below, or by using the keyword search tool below to find specific information within the annual report.-
 1
1 -
2
-
3
-
4
-
5
-
6
-
7
-
8
-
9
-
10
-
11
-
12
-
13
-
14
-
15
-
16
-
17
-
18
-
19
-
20
-
21
-
22
-
23
-
24
-
25
-
26
-
27
-
28
-
29
-
30
-
31
-
32
-
33
-
34
-
35
-
36
-
37
-
38
-
39
-
40
-
41
-
42
-
43
-
44
-
45
-
46
-
47
-
48
-
49
-
50
-
51
-
52
-
53
-
54
-
55
-
56
-
57
-
58
-
59
-
60
-
61
-
62
-
63
-
 64
64 -
 65
65 -
 66
66 -
 67
67 -
 68
68 -
 69
69 -
 70
70 -
 71
71 -
 72
72 -
 73
73 -
 74
74 -
 75
75 -
 76
76 -
 77
77 -
 78
78 -
 79
79 -
 80
80 -
 81
81 -
 82
82 -
 83
83 -
 84
84 -
85
-
86
-
87
-
88
-
89
-
90
-
91
-
92
-
93
-
94
-
95
-
96
-
97
-
98
-
99
-
100
-
101
-
102
-
103
-
104
-
105
-
106
-
107
-
108
-
109
-
110
-
111
-
112
-
113
-
114
-
115
-
116
-
117
-
118
-
119
-
120
-
121
-
122
-
123
-
124
-
125
-
126
-
127
-
128
-
129
-
130
-
131
-
132
-
133
-
134
-
135
-
136
-
137
-
138
-
139
-
140
-
141
-
142
-
143
-
144
-
145
-
146
-
147
-
148
-
149
-
150
-
151
-
152
-
153
-
154
-
155
-
156
-
157
-
158
-
159
-
160
-
161
-
162
-
163
-
164
-
165
-
166
-
167
-
168
-
169
-
170
-
171
-
172
-
173
-
174
-
175
-
176
-
177
-
178
-
179
-
180
-
181
-
182
-
183
-
184
-
185
-
186
-
187
-
188
-
189
-
190
-
191
-
192
-
193
-
194
-
195
 |
 |

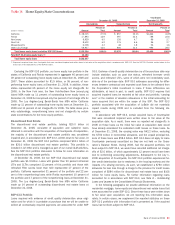
Table 26 Commercial Credit Exposure by Type
December 31
Commercial Utilized
(1, 2)
Commercial Unfunded
(3, 4)
Total Commercial
Committed
(Dollars in millions) 2008 2007 2008 2007 2008 2007
Loans and leases
$342,767
$325,143
$300,856
$329,396
$643,623
$654,539
Standby letters of credit and financial guarantees
72,840
58,747
4,740
4,049
77,580
62,796
Derivative assets
(5)
62,252
34,662
–
–
62,252
34,662
Assets held-for-sale
(6)
14,206
26,475
183
1,489
14,389
27,964
Commercial letters of credit
2,974
4,413
791
140
3,765
4,553
Bankers’ acceptances
3,389
2,411
13
2
3,402
2,413
Foreclosed properties
321
75
–
–
321
75
Total commercial credit exposure
$498,749
$451,926
$306,583
$335,076
$805,332
$787,002
(1) Exposure includes standby letters of credit, financial guarantees, commercial letters of credit and bankers’ acceptances for which the bank is legally bound to advance funds under prescribed conditions, during a
specified period. Although funds have not been advanced, these exposure types are considered utilized for credit risk management purposes.
(2) Total commercial utilized exposure at December 31, 2008 and 2007 includes loans and issued letters of credit measured at fair value in accordance with SFAS 159 and is comprised of loans outstanding of $5.4
billion and $4.6 billion and letters of credit at notional value of $1.4 billion and $1.1 billion.
(3) Total commercial unfunded exposure at December 31, 2008 and 2007 includes loan commitments measured at fair value in accordance with SFAS 159 with a notional value of $15.5 billion and $19.8 billion.
(4) Excludes unused business card lines which are not legally binding.
(5) Derivative assets are reported on a mark-to-market basis, reflect the effects of legally enforceable master netting agreements, and have been reduced by cash collateral of $34.8 billion and $12.8 billion at
December 31, 2008 and 2007. In addition to cash collateral, derivative assets are also collateralized by $7.7 billion and $8.5 billion of primarily other marketable securities at December 31, 2008 and 2007 for which
credit risk has not been reduced.
(6) Total commercial committed asset held-for-sale exposure consists of $12.1 billion and $23.9 billion of commercial LHFS exposure (e.g., commercial mortgage and leveraged finance) and $2.3 billion and $4.1 billion of
investments held-for-sale exposure at December 31, 2008 and 2007.
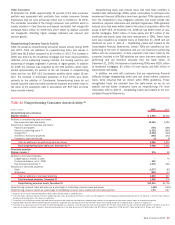
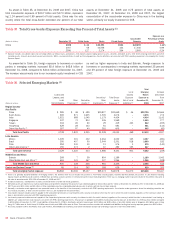
Table 26 presents commercial credit exposure by type for utilized,
unfunded and total binding committed credit exposure. The increase in
standby letters of credit and financial guarantees of $14.8 billion was
concentrated in the government, healthcare providers and education
sectors. The increase in derivative assets of $27.6 billion was centered
in interest rate swaps, foreign exchange contracts and credit derivatives,
and was driven by interest rate shifts, especially during the latter part of
the year, the strengthening of the U.S. dollar against certain foreign cur-
rencies, and widening credit spreads. The decrease of $13.6 billion in
assets held-for-sale was driven primarily by distributions and sales, com-
pleted securitizations, reduced underwriting activity, and mark-to-market
writedowns. For more information on our credit derivatives, see Industry
Concentrations beginning on page 76 and for more information on our
funded leveraged finance and CMBS exposures refer to Management of
Commercial Credit Risk Concentrations on page 70.
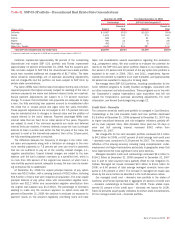
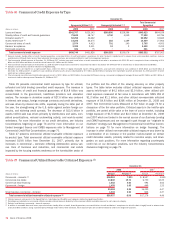
Table 27 presents commercial utilized reservable criticized exposure
by product type. Total commercial utilized reservable criticized exposure
increased $19.8 billion from December 31, 2007, primarily due to
increases in commercial – domestic reflecting deterioration across vari-
ous lines of business and industries, and commercial real estate
impacted by the housing markets weakness on the homebuilder sector of
the portfolio and the effect of the slowing economy on other property
types. The table below excludes utilized criticized exposure related to
assets held-for-sale of $4.2 billion and $2.9 billion, other utilized criti-
cized exposure measured at fair value in accordance with SFAS 159 of
$1.3 billion and $1.1 billion, and other utilized non-reservable criticized
exposure of $4.8 billion and $368 million at December 31, 2008 and
2007. See Commercial Loans Measured at Fair Value on page 74 for a
discussion of the fair value portfolio. Criticized assets in the held-for-sale
portfolio, are carried at fair value or the lower of cost or market, including
bridge exposure of $1.5 billion and $2.3 billion at December 31, 2008
and 2007 which are funded in the normal course of our Business Lending
and CMAS businesses and are managed in part through our “originate to
distribute” strategy (see Management of Commercial Credit Risk Concen-
trations on page 70 for more information on bridge financing). The
increase in other utilized non-reservable criticized exposure was driven by
a combination of an increase in the positive mark-to-market on certain
credit derivative assets, primarily related to monoline wraps, and down-
grades on such positions. For more information regarding counterparty
credit risk on our derivative positions, see the Industry Concentrations
discussion beginning on page 76.
Table 27 Commercial Utilized Reservable Criticized Exposure (1)
December 31
2008 2007
(Dollars in millions) Amount Percent
(2)
Amount Percent
(2)
Commercial – domestic
(3)
$18,963
7.20% $ 8,537 3.55%
Commercial real estate
13,830
19.73 6,750 10.25
Commercial lease financing
1,352
6.03 594 2.63
Commercial – foreign
1,459
3.65 449 1.23
35,604
8.99 16,330 4.47
Small business commercial – domestic
1,333
6.94 846 4.37
Total commercial utilized reservable criticized exposure (4)
$36,937 8.90
$17,176 4.46
(1) Criticized exposure corresponds to the Special Mention, Substandard and Doubtful asset categories defined by regulatory authorities.
(2) Percentages are calculated as commercial utilized reservable criticized exposure divided by total commercial utilized reservable exposure for each exposure category.
(3) Excludes small business commercial – domestic exposure.
(4) In addition to reservable loans and leases, exposure includes standby letters of credit, financial guarantees, commercial letters of credit and bankers’ acceptances for which the bank is legally bound to advance funds
under prescribed conditions, during a specified period. Although funds have not been advanced, these exposure types are considered utilized for credit risk management purposes.
72
Bank of America 2008