Bank of America 2008 Annual Report Download - page 76
Download and view the complete annual report
Please find page 76 of the 2008 Bank of America annual report below. You can navigate through the pages in the report by either clicking on the pages listed below, or by using the keyword search tool below to find specific information within the annual report.-
 1
1 -
2
-
3
-
4
-
5
-
6
-
7
-
8
-
9
-
10
-
11
-
12
-
13
-
14
-
15
-
16
-
17
-
18
-
19
-
20
-
21
-
22
-
23
-
24
-
25
-
26
-
27
-
28
-
29
-
30
-
31
-
32
-
33
-
34
-
35
-
36
-
37
-
38
-
39
-
40
-
41
-
42
-
43
-
44
-
45
-
46
-
47
-
48
-
49
-
50
-
51
-
52
-
53
-
54
-
55
-
56
-
57
-
58
-
59
-
60
-
61
-
62
-
63
-
64
-
65
-
 66
66 -
 67
67 -
 68
68 -
 69
69 -
 70
70 -
 71
71 -
 72
72 -
 73
73 -
 74
74 -
 75
75 -
 76
76 -
 77
77 -
 78
78 -
 79
79 -
 80
80 -
 81
81 -
 82
82 -
 83
83 -
 84
84 -
 85
85 -
 86
86 -
87
-
88
-
89
-
90
-
91
-
92
-
93
-
94
-
95
-
96
-
97
-
98
-
99
-
100
-
101
-
102
-
103
-
104
-
105
-
106
-
107
-
108
-
109
-
110
-
111
-
112
-
113
-
114
-
115
-
116
-
117
-
118
-
119
-
120
-
121
-
122
-
123
-
124
-
125
-
126
-
127
-
128
-
129
-
130
-
131
-
132
-
133
-
134
-
135
-
136
-
137
-
138
-
139
-
140
-
141
-
142
-
143
-
144
-
145
-
146
-
147
-
148
-
149
-
150
-
151
-
152
-
153
-
154
-
155
-
156
-
157
-
158
-
159
-
160
-
161
-
162
-
163
-
164
-
165
-
166
-
167
-
168
-
169
-
170
-
171
-
172
-
173
-
174
-
175
-
176
-
177
-
178
-
179
-
180
-
181
-
182
-
183
-
184
-
185
-
186
-
187
-
188
-
189
-
190
-
191
-
192
-
193
-
194
-
195
 |
 |
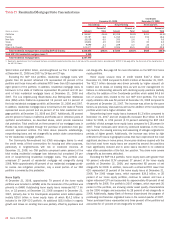
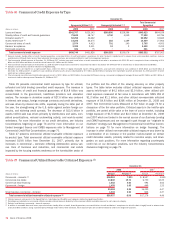
Commercial – Foreign
The commercial – foreign portfolio is managed primarily in Business Lend-
ing and CMAS. Outstanding loans increased $2.6 billion to $31.0 billion
at December 31, 2008 compared to 2007 driven by organic growth parti-
ally offset by strengthening of the U.S. dollar against foreign currencies.
Utilized reservable criticized exposure increased $1.0 billion to $1.5 bil-
lion. Net charge-offs increased $172 million from $1 million largely con-
centrated in a few financial services borrowers, the majority of which were
Icelandic banks. The remaining net charge-offs were diverse in terms of
industries and countries. For additional information on the commercial –
foreign portfolio, refer to the Foreign Portfolio discussion beginning on
page 79.
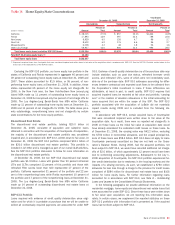
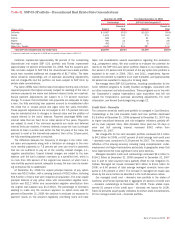
Small Business Commercial – Domestic
The small business commercial – domestic portfolio (business card and
small business loans) is managed in GCSBB. Outstanding small business
commercial – domestic loans decreased $141 million to $19.1 billion at
December 31, 2008 compared to 2007. Approximately 60 percent of the
small business commercial – domestic outstanding loans at
December 31, 2008 were credit card related products. Nonperforming
small business commercial – domestic loans increased $53 million to
$205 million, loans past due 90 days or more and still accruing interest
increased $213 million to $640 million and utilized reservable criticized
exposure increased $487 million, to $1.3 billion at December 31, 2008
compared to 2007. Net charge-offs were up $1.1 billion, to $1.9 billion,
or 9.80 percent of total average small business commercial – domestic
loans. Approximately 75 percent of the small business commercial –
domestic net charge-offs in 2008 were credit card related products
compared to 70 percent in 2007. The increases were primarily driven by
the impacts of a slowing economy, particularly in geographic areas that
have experienced the most significant home price declines and seasoning
of vintages originated in periods of higher growth.
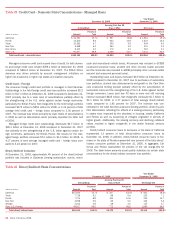
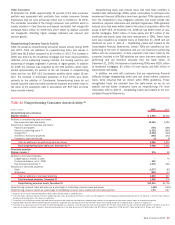
Commercial Loans Measured at Fair Value
The portfolio of commercial loans measured at fair value is managed in
CMAS. Outstanding commercial loans measured at fair value increased
$823 million to an aggregate fair value of $5.4 billion at December 31,
2008 compared to 2007 and were comprised of commercial – domestic
loans, excluding small business, of $3.5 billion, commercial – foreign
loans of $1.7 billion and commercial real estate loans of $203 million.
The aggregate increase of $823 million was driven primarily by increased
draws on existing and new lines of credit. We recorded net losses in other
income of $775 million resulting from changes in the fair value of the
loan portfolio during 2008 compared to losses of $139 million for 2007.
These losses were primarily attributable to changes in instrument-specific
credit risk and were predominately offset by gains from hedging activities.
At December 31, 2008 none of these loans were 90 days or more past
due and still accruing interest or had been placed on nonaccrual status.
Utilized criticized exposure in the fair value portfolio was $1.3 billion and
$1.1 billion at December 31, 2008 and 2007.
In addition, unfunded lending commitments and letters of credit had
an aggregate fair value of $1.1 billion and $660 million at December 31,
2008 and 2007 and were recorded in accrued expenses and other
liabilities. The associated aggregate notional amount of unfunded lending
commitments and letters of credit subject to fair value treatment was
$16.9 billion and $20.9 billion at December 31, 2008 and 2007. Net
losses resulting from changes in fair value of commitments and letters of
credit of $473 million were recorded in other income during the year
ended December 31, 2008 compared to losses of $274 million in 2007.
These losses were primarily attributable to changes in instrument-specific
credit risk and were predominately offset by gains from hedging activities.
74
Bank of America 2008