Bank of America 2008 Annual Report Download - page 83
Download and view the complete annual report
Please find page 83 of the 2008 Bank of America annual report below. You can navigate through the pages in the report by either clicking on the pages listed below, or by using the keyword search tool below to find specific information within the annual report.-
 1
1 -
2
-
3
-
4
-
5
-
6
-
7
-
8
-
9
-
10
-
11
-
12
-
13
-
14
-
15
-
16
-
17
-
18
-
19
-
20
-
21
-
22
-
23
-
24
-
25
-
26
-
27
-
28
-
29
-
30
-
31
-
32
-
33
-
34
-
35
-
36
-
37
-
38
-
39
-
40
-
41
-
42
-
43
-
44
-
45
-
46
-
47
-
48
-
49
-
50
-
51
-
52
-
53
-
54
-
55
-
56
-
57
-
58
-
59
-
60
-
61
-
62
-
63
-
64
-
65
-
66
-
67
-
68
-
69
-
70
-
71
-
72
-
 73
73 -
 74
74 -
 75
75 -
 76
76 -
 77
77 -
 78
78 -
 79
79 -
 80
80 -
 81
81 -
 82
82 -
 83
83 -
 84
84 -
 85
85 -
 86
86 -
 87
87 -
 88
88 -
 89
89 -
 90
90 -
 91
91 -
 92
92 -
 93
93 -
94
-
95
-
96
-
97
-
98
-
99
-
100
-
101
-
102
-
103
-
104
-
105
-
106
-
107
-
108
-
109
-
110
-
111
-
112
-
113
-
114
-
115
-
116
-
117
-
118
-
119
-
120
-
121
-
122
-
123
-
124
-
125
-
126
-
127
-
128
-
129
-
130
-
131
-
132
-
133
-
134
-
135
-
136
-
137
-
138
-
139
-
140
-
141
-
142
-
143
-
144
-
145
-
146
-
147
-
148
-
149
-
150
-
151
-
152
-
153
-
154
-
155
-
156
-
157
-
158
-
159
-
160
-
161
-
162
-
163
-
164
-
165
-
166
-
167
-
168
-
169
-
170
-
171
-
172
-
173
-
174
-
175
-
176
-
177
-
178
-
179
-
180
-
181
-
182
-
183
-
184
-
185
-
186
-
187
-
188
-
189
-
190
-
191
-
192
-
193
-
194
-
195
 |
 |
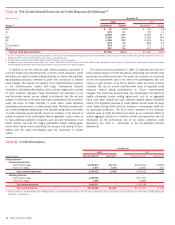
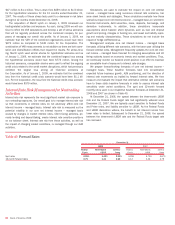
At December 31, 2008 and 2007, 73 percent and 71 percent of the
emerging markets exposure was in Asia Pacific. Emerging markets
exposure in Asia Pacific increased by $4.9 billion driven by higher cross-
border exposure in China and India. Our exposure in China was primarily
related to our equity investment in CCB which accounted for $19.7 billion
and $16.4 billion at December 31, 2008 and 2007. In 2008, under the
terms of our purchase option we increased our ownership in CCB by pur-
chasing 25.6 billion common shares for approximately $9.2 billion. These
recently purchased shares are accounted for at cost in other assets and
are non-transferable until August 2011. In addition in January 2009, we
sold 5.6 billion common shares of our initial investment in CCB for $2.8
billion, reducing our ownership to 16.7 percent and resulting in a pre-tax
gain of approximately $1.9 billion. The remaining initial investment of
13.5 billion common shares is accounted for at fair value and recorded
as AFS marketable equity securities in other assets with an offset,
net-of-tax, to accumulated OCI. These shares became transferable in
October 2008.
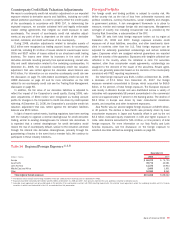
At December 31, 2008, 20 percent of the emerging markets exposure
was in Latin America compared to 23 percent at December 31, 2007.
Latin America emerging markets exposure decreased by $239 million
driven by lower cross-border exposures in Mexico and Chile. The decline
in Mexico is primarily driven by the decline in value of our equity invest-
ment in Santander due to the strengthening of the U.S. dollar. Our 24.9
percent investment in Santander, which is classified as securities and
other investments in the preceding table, accounted for $2.1 billion and
$2.6 billion of exposure in Mexico at December 31, 2008 and
December 31, 2007. Our exposure in Brazil was primarily related to the
carrying value of our investment in Banco Itaú, which accounted for $2.5
billion and $2.6 billion of exposure in Brazil at December 31, 2008 and
December 31, 2007. Our equity investment in Banco Itaú represents
eight percent and seven percent of its outstanding voting and non-voting
shares at December 31, 2008 and 2007.
At both December 31, 2008 and 2007, five percent of the emerging
markets exposure was in Middle East and Africa. Middle East and Africa
emerging markets exposure increased by $514 million, driven by
increased cross-border securities and other investments exposures in
Bahrain which were primarily collateralized by mortgage-backed securities
issued by U.S. government sponsored entities.
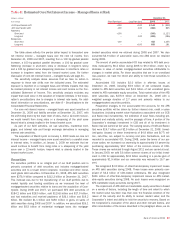
Provision for Credit Losses
The provision for credit losses increased $18.4 billion to $26.8 billion in
2008 compared to 2007.
The consumer portion of the provision for credit losses increased
$15.2 billion to $21.8 billion compared to 2007. The higher provision
expense was largely driven by higher net charge-offs and reserve
increases in our home equity and residential mortgage portfolios
reflective of deterioration in the housing markets particularly in geo-
graphic areas that have experienced the most significant declines in
home prices as well as deterioration in our Countrywide SOP 03-3 portfo-
lio subsequent to the July 1, 2008 acquisition. Furthermore, the slowing
economy and portfolio deterioration resulted in higher credit costs in the
unsecured lending and domestic credit card portfolios.
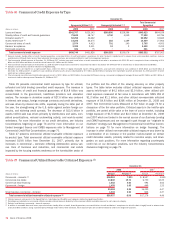
The commercial portion of the provision for credit losses increased
$3.2 billion to $5.0 billion compared to 2007. The increase was driven by
higher net charge-offs in our small business portfolios within GCSBB
reflecting deterioration from the impacts of a slowing economy particularly
in geographic areas that have experienced the most significant home
price declines. Higher net charge-offs were also experienced in commer-
cial real estate, primarily the homebuilder loan portfolio, as well as
commercial domestic and foreign net charge-offs, which were broad-
based in terms of both borrowers and industries and up from very low
levels in 2007. Reserves were increased for deterioration in the home-
builder and non real estate commercial portfolios within GCIB as well as
in the small business portfolio within GCSBB. In addition, the absence of
2007 reserve reductions in All Other also contributed to the increase in
provision.
Allowance for Credit Losses
The allowance for loan and lease losses excludes loans measured at fair
value in accordance with SFAS 159 as subsequent mark-to-market
adjustments related to loans measured at fair value include a credit risk
component. The allowance for loan and lease losses is allocated based
on two components. We evaluate the adequacy of the allowance for loan
and lease losses based on the combined total of these two components.
The first component of the allowance for loan and lease losses covers
those commercial loans excluding loans measured at fair value that are
either nonperforming or impaired. An allowance is allocated when the
discounted cash flows (or collateral value or observable market price) are
lower than the carrying value of that loan. For purposes of computing the
specific loss component of the allowance, larger impaired loans are eval-
uated individually and smaller impaired loans are evaluated as a pool
using historical loss experience for the respective product type and risk
rating of the loans.
The second component of the allowance for loan and lease losses
covers performing consumer and commercial loans and leases excluding
loans measured at fair value. The allowance for commercial loan and
lease losses is established by product type after analyzing historical loss
experience by internal risk rating, current economic conditions, industry
performance trends, geographic or obligor concentrations within each
portfolio segment, and any other pertinent information. The commercial
historical loss experience is updated quarterly to incorporate the most
recent data reflective of the current economic environment. As of
December 31, 2008 quarterly updating of historical loss experience did
not have a material impact on the allowance for loan and lease losses.
The allowance for consumer and certain homogeneous commercial loan
and lease products is based on aggregated portfolio segment evalua-
tions, generally by product type. Loss forecast models are utilized that
consider a variety of factors including, but not limited to, historical loss
experience, estimated defaults or foreclosures based on portfolio trends,
delinquencies, economic trends and credit scores. These loss forecast
models are updated on a quarterly basis in order to incorporate
information reflective of the current economic environment. As of
December 31, 2008 quarterly updating of the loss forecast models
resulted in increases in the allowance for loan and lease losses driven by
higher losses primarily in the home equity portfolio, reflective of deterio-
ration in the housing markets, portfolio deterioration on the consumer
card and unsecured lending portfolios and deterioration and reduced col-
lateral values in the retail dealer-related loan portfolios.
We monitor differences between estimated and actual incurred loan
and lease losses. This monitoring process includes periodic assess-
ments by senior management of loan and lease portfolios and the models
used to estimate incurred losses in those portfolios.
Additions to the allowance for loan and lease losses are made by
charges to the provision for credit losses. Credit exposures deemed to be
uncollectible are charged against the allowance for loan and lease loss-
es. Recoveries of previously charged off amounts are credited to the
allowance for loan and lease losses.
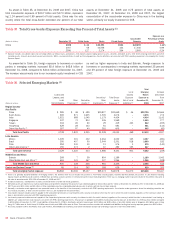
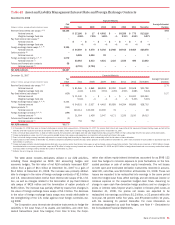
The allowance for loan and lease losses for the consumer portfolio as
presented in Table 38 was $16.7 billion at December 31, 2008, an
increase of $9.9 billion from December 31, 2007. This increase was
primarily driven by reserve increases related to higher losses in our home
equity, unsecured lending, consumer card, and residential mortgage port-
Bank of America 2008
81