Bank of America 2008 Annual Report Download - page 91
Download and view the complete annual report
Please find page 91 of the 2008 Bank of America annual report below. You can navigate through the pages in the report by either clicking on the pages listed below, or by using the keyword search tool below to find specific information within the annual report.-
 1
1 -
2
-
3
-
4
-
5
-
6
-
7
-
8
-
9
-
10
-
11
-
12
-
13
-
14
-
15
-
16
-
17
-
18
-
19
-
20
-
21
-
22
-
23
-
24
-
25
-
26
-
27
-
28
-
29
-
30
-
31
-
32
-
33
-
34
-
35
-
36
-
37
-
38
-
39
-
40
-
41
-
42
-
43
-
44
-
45
-
46
-
47
-
48
-
49
-
50
-
51
-
52
-
53
-
54
-
55
-
56
-
57
-
58
-
59
-
60
-
61
-
62
-
63
-
64
-
65
-
66
-
67
-
68
-
69
-
70
-
71
-
72
-
73
-
74
-
75
-
76
-
77
-
78
-
79
-
80
-
 81
81 -
 82
82 -
 83
83 -
 84
84 -
 85
85 -
 86
86 -
 87
87 -
 88
88 -
 89
89 -
 90
90 -
 91
91 -
 92
92 -
 93
93 -
 94
94 -
 95
95 -
 96
96 -
 97
97 -
 98
98 -
 99
99 -
 100
100 -
 101
101 -
102
-
103
-
104
-
105
-
106
-
107
-
108
-
109
-
110
-
111
-
112
-
113
-
114
-
115
-
116
-
117
-
118
-
119
-
120
-
121
-
122
-
123
-
124
-
125
-
126
-
127
-
128
-
129
-
130
-
131
-
132
-
133
-
134
-
135
-
136
-
137
-
138
-
139
-
140
-
141
-
142
-
143
-
144
-
145
-
146
-
147
-
148
-
149
-
150
-
151
-
152
-
153
-
154
-
155
-
156
-
157
-
158
-
159
-
160
-
161
-
162
-
163
-
164
-
165
-
166
-
167
-
168
-
169
-
170
-
171
-
172
-
173
-
174
-
175
-
176
-
177
-
178
-
179
-
180
-
181
-
182
-
183
-
184
-
185
-
186
-
187
-
188
-
189
-
190
-
191
-
192
-
193
-
194
-
195
 |
 |

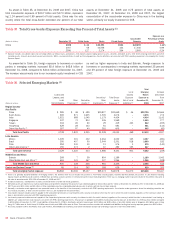
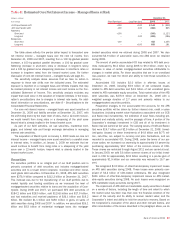
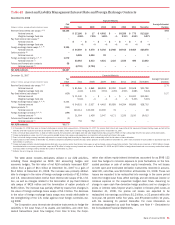
Table 41 Estimated Core Net Interest Income – Managed Basis at Risk
(Dollars in millions) December 31
Curve Change Short Rate (bps) Long Rate (bps) 2008 2007
+100 bps Parallel shift +100 +100
$ 144
$ (952)
-100 bps Parallel shift -100 -100
(186)
865
Flatteners
Short end +100 –
(545)
(1,127)
Long end – -100
(638)
(386)
Steepeners
Short end -100 –
453
1,255
Long end – +100
698
181
The table above reflects the pre-tax dollar impact to forecasted core
net interest income – managed basis over the next 12 months from
December 31, 2008 and 2007, resulting from a 100 bp gradual parallel
increase, a 100 bp gradual parallel decrease, a 100 bp gradual curve
flattening (increase in short-term rates or decrease in long-term rates)
and a 100 bp gradual curve steepening (decrease in short-term rates or
increase in long-term rates) from the forward market curve. For further
discussion of core net interest income – managed basis see page 31.
The sensitivity analysis above assumes that we take no action in
response to these rate shifts over the indicated years. The estimated
exposure is reported on a managed basis and reflects impacts that may
be realized primarily in net interest income and card income on the Con-
solidated Statement of Income. This sensitivity analysis excludes any
impact that could occur in the valuation of retained interests in the Corpo-
ration’s securitizations due to changes in interest rate levels. For addi-
tional information on securitizations, see Note 8 – Securitizations to the
Consolidated Financial Statements.
Our core net interest income – managed basis was asset sensitive at
December 31, 2008 and liability sensitive at December 31, 2007, with
the shift being driven by the lower level of rates. Over a 12-month horizon,
we would benefit from rising rates or a steepening of the yield curve
beyond what is already implied in the forward market curve.
As part of our ALM activities, we use securities, residential mort-
gages, and interest rate and foreign exchange derivatives in managing
interest rate sensitivity.
The acquisition of Merrill Lynch on January 1, 2009 made our core net
interest income – managed basis more asset sensitive to a parallel move
in interest rates. In addition, at January 1, 2009 we estimate that we
would continue to benefit from rising rates or a steepening of the yield
curve over a 12-month horizon, beyond what is already implied in the
forward market curve.
Securities
The securities portfolio is an integral part of our ALM position and is
primarily comprised of debt securities and includes mortgage-backed
securities and to a lesser extent corporate, municipal and other invest-
ment grade debt securities. At December 31, 2008, AFS debt securities
were $276.9 billion compared to $213.3 billion at December 31, 2007.
This increase was due to the repositioning of our ALM portfolio due to
market liquidity and funding conditions as we increased the level of
mortgage-backed securities relative to loans and the acquisition of Coun-
trywide. During 2008 and 2007, we purchased AFS debt securities of
$184.2 billion and $28.0 billion, sold $119.8 billion and $27.9 billion,
and had maturities and received paydowns of $26.1 billion and $19.2
billion. We realized $1.1 billion and $180 million in gains on sales of
debt securities during 2008 and 2007. In addition, we securitized $26.1
billion and $5.5 billion of residential mortgage loans into mortgage-
backed securities which we retained during 2008 and 2007. We also
converted $4.9 billion of automobile loans into ABS which we retained
during 2008.
The amount of pre-tax accumulated OCI loss related to AFS debt secu-
rities increased by $6.4 billion during 2008 to $9.3 billion, driven by a
decrease in value of certain mortgage-backed securities attributable to
changes in market yields. For those securities that are in an unrealized
loss position, we have the intent and ability to hold these securities to
recovery.
Accumulated OCI includes $2.0 billion in after-tax losses at
December 31, 2008, including $5.9 billion of net unrealized losses
related to AFS debt securities and $3.9 billion of net unrealized gains
related to AFS marketable equity securities. Total market value of the AFS
debt securities was $276.9 billion at December 31, 2008 with a
weighted average duration of 2.7 years and primarily relates to our
mortgage-backed securities portfolio.
Prospective changes to the accumulated OCI amounts for the AFS
securities portfolio will be driven by further interest rate, credit or price
fluctuations (including market value fluctuations associated with our CCB
and Banco Itaú investments), the collection of cash flows including pre-
payment and maturity activity, and the passage of time. A portion of the
Corporation’s strategic investment in CCB and all of its investment in
Banco Itaú are carried at fair value. The carrying values of CCB and Banco
Itaú were $19.7 billion and $2.5 billion at December 31, 2008. Unreal-
ized gains (losses) on these investments of $4.8 billion and $(77) mil-
lion, net-of-tax, are subject to currency and price fluctuations, and are
recorded in accumulated OCI. During 2008, under the terms of our pur-
chase option, we increased our ownership to approximately 19 percent by
purchasing approximately $9.2 billion of the common shares of CCB.
These shares are restricted through August 2011 and are carried at cost.
In January 2009, we sold 5.6 billion common shares of our initial invest-
ment in CCB for approximately $2.8 billion resulting in a pre-tax gain of
approximately $1.9 billion and our ownership was reduced to 16.7 per-
cent.
We recognized $3.5 billion of other-than-temporary impairment losses
on AFS debt securities during 2008. These losses were primarily com-
prised of $3.2 billion of CDO-related writedowns. We also recognized
$661 million of other-than-temporary impairment losses on AFS market-
able equity securities during 2008. No such losses were recognized on
AFS marketable equity securities during 2007.
The impairment of AFS debt and marketable equity securities is based
on a variety of factors, including the length of time and extent to which
the market value has been less than cost; the financial condition of the
issuer of the security and its ability to recover market value; and the
Corporation’s intent and ability to hold the security to recovery. Based on
the Corporation’s evaluation of the above and other relevant factors, and
after consideration of the losses described in the paragraph above, we do
Bank of America 2008
89