Bank of America 2008 Annual Report Download - page 68
Download and view the complete annual report
Please find page 68 of the 2008 Bank of America annual report below. You can navigate through the pages in the report by either clicking on the pages listed below, or by using the keyword search tool below to find specific information within the annual report.-
 1
1 -
2
-
3
-
4
-
5
-
6
-
7
-
8
-
9
-
10
-
11
-
12
-
13
-
14
-
15
-
16
-
17
-
18
-
19
-
20
-
21
-
22
-
23
-
24
-
25
-
26
-
27
-
28
-
29
-
30
-
31
-
32
-
33
-
34
-
35
-
36
-
37
-
38
-
39
-
40
-
41
-
42
-
43
-
44
-
45
-
46
-
47
-
48
-
49
-
50
-
51
-
52
-
53
-
54
-
55
-
56
-
57
-
 58
58 -
 59
59 -
 60
60 -
 61
61 -
 62
62 -
 63
63 -
 64
64 -
 65
65 -
 66
66 -
 67
67 -
 68
68 -
 69
69 -
 70
70 -
 71
71 -
 72
72 -
 73
73 -
 74
74 -
 75
75 -
 76
76 -
 77
77 -
 78
78 -
79
-
80
-
81
-
82
-
83
-
84
-
85
-
86
-
87
-
88
-
89
-
90
-
91
-
92
-
93
-
94
-
95
-
96
-
97
-
98
-
99
-
100
-
101
-
102
-
103
-
104
-
105
-
106
-
107
-
108
-
109
-
110
-
111
-
112
-
113
-
114
-
115
-
116
-
117
-
118
-
119
-
120
-
121
-
122
-
123
-
124
-
125
-
126
-
127
-
128
-
129
-
130
-
131
-
132
-
133
-
134
-
135
-
136
-
137
-
138
-
139
-
140
-
141
-
142
-
143
-
144
-
145
-
146
-
147
-
148
-
149
-
150
-
151
-
152
-
153
-
154
-
155
-
156
-
157
-
158
-
159
-
160
-
161
-
162
-
163
-
164
-
165
-
166
-
167
-
168
-
169
-
170
-
171
-
172
-
173
-
174
-
175
-
176
-
177
-
178
-
179
-
180
-
181
-
182
-
183
-
184
-
185
-
186
-
187
-
188
-
189
-
190
-
191
-
192
-
193
-
194
-
195
 |
 |

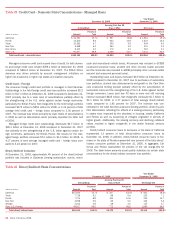
Table 19 SOP 03-3 Portfolio – Residential Mortgage State Concentrations
December 31, 2008 Year Ended December 31, 2008
Outstandings SOP 03-3 Net Charge-offs
(1)
(Dollars in millions) Amount
Percent of
Total Amount Percent of Total
California $5,598 56.3% $177 40.4%
Florida 771 7.7 103 23.5
Virginia 553 5.6 14 3.2
Maryland 251 2.5 6 1.4
Texas 147 1.5 5 1.1
Other U.S. / Foreign 2,629 26.4 133 30.4
Total SOP 03-3 residential mortgage loans
$9,949 100.0% $438 100.0%
(1) Represents additional net charge-offs for 2008 had the portfolio not been subject to SOP 03-3.
Residential Mortgage
The residential mortgage SOP 03-3 portfolio outstandings were $9.9 bil-
lion at December 31, 2008 and comprised 24 percent of the total SOP
03-3 portfolio. Those loans with a refreshed FICO score lower than 620
represented 26 percent of the residential mortgage SOP 03-3 portfolio at
December 31, 2008. Refreshed LTVs greater than 90 percent after con-
sideration of purchase accounting adjustments and refreshed LTVs
greater than 90 percent based on the unpaid principal balance repre-
sented 58 percent and 82 percent of the residential mortgage portfolio.
California represented approximately 56 percent of the outstanding
residential mortgage SOP 03-3 portfolio and Florida represented approx-
imately eight percent at December 31, 2008. Had the acquired portfolio
not been subject to SOP 03-3 the residential mortgage portfolio would
have recorded additional net charge-offs of $438 million. The table above
presents outstandings net of purchase accounting adjustments and net
charge-offs had the portfolio not been subject to SOP 03-3, by certain
state concentrations.
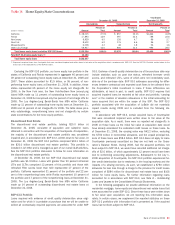
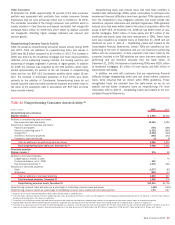
Home Equity
The home equity SOP 03-3 outstandings were $14.2 billion at
December 31, 2008 and comprised 34 percent of the total SOP 03-3
portfolio. Those loans with a refreshed FICO score lower than 620 repre-
sented 19 percent of the home equity SOP 03-3 portfolio at
December 31, 2008. Refreshed CLTVs greater than 90 percent repre-
sented 80 percent of the home equity portfolio after consideration of
purchase accounting adjustments. Refreshed CLTVs greater than 90
percent based on the unpaid principal balance represented 88 percent of
the home equity portfolio at December 31, 2008.
California represented approximately 36 percent of the outstanding
home equity SOP 03-3 portfolio and Florida represented approximately
seven percent at December 31, 2008. Had the acquired portfolio not
been subject to SOP 03-3 the home equity portfolio would have recorded
additional net charge-offs of $1.5 billion. The table below presents out-
standings net of purchase accounting adjustments and net charge-offs
had the portfolio not been subject to SOP 03-3, by certain state concen-
trations.
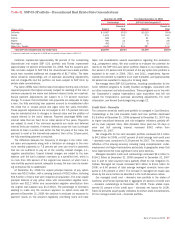
Discontinued Real Estate
The discontinued real estate SOP 03-3 portfolio outstandings were $18.1
billion at December 31, 2008 and comprised 42 percent of the total SOP
03-3 portfolio. Those loans with a refreshed FICO score lower than 620
represented 32 percent of the discontinued real estate SOP 03-3 portfo-
lio at December 31, 2008. Refreshed LTVs and CLTVs greater than 90
percent represented 40 percent of the discontinued real estate portfolio
after consideration of purchase accounting adjustments. Refreshed LTVs
and CLTVs greater than 90 percent based on the unpaid principal balance
represented 73 percent of the discontinued real estate portfolio at
December 31, 2008.
Table 20 SOP 03-3 Portfolio – Home Equity State Concentrations
December 31, 2008 Year Ended December 31, 2008
Outstandings SOP 03-3 Net Charge-offs
(1)
(Dollars in millions) Amount
Percent of
Total Amount Percent of Total
California $ 5,133 36.2% $ 744 49.8%
Florida 914 6.5 186 12.4
Arizona 629 4.4 79 5.3
Virginia 532 3.8 42 2.8
Colorado 404 2.9 22 1.5
Other U.S. / Foreign 6,551 46.2 421 28.2
Total SOP 03-3 home equity loans
$14,163 100.0% $1,494 100.0%
(1) Represents additional net charge-offs for 2008 had the portfolio not been subject to SOP 03-3.
66
Bank of America 2008