Bank of America 2008 Annual Report Download - page 35
Download and view the complete annual report
Please find page 35 of the 2008 Bank of America annual report below. You can navigate through the pages in the report by either clicking on the pages listed below, or by using the keyword search tool below to find specific information within the annual report.-
 1
1 -
2
-
3
-
4
-
5
-
6
-
7
-
8
-
9
-
10
-
11
-
12
-
13
-
14
-
15
-
16
-
17
-
18
-
19
-
20
-
21
-
22
-
23
-
24
-
 25
25 -
 26
26 -
 27
27 -
 28
28 -
 29
29 -
 30
30 -
 31
31 -
 32
32 -
 33
33 -
 34
34 -
 35
35 -
 36
36 -
 37
37 -
 38
38 -
 39
39 -
 40
40 -
 41
41 -
 42
42 -
 43
43 -
 44
44 -
 45
45 -
46
-
47
-
48
-
49
-
50
-
51
-
52
-
53
-
54
-
55
-
56
-
57
-
58
-
59
-
60
-
61
-
62
-
63
-
64
-
65
-
66
-
67
-
68
-
69
-
70
-
71
-
72
-
73
-
74
-
75
-
76
-
77
-
78
-
79
-
80
-
81
-
82
-
83
-
84
-
85
-
86
-
87
-
88
-
89
-
90
-
91
-
92
-
93
-
94
-
95
-
96
-
97
-
98
-
99
-
100
-
101
-
102
-
103
-
104
-
105
-
106
-
107
-
108
-
109
-
110
-
111
-
112
-
113
-
114
-
115
-
116
-
117
-
118
-
119
-
120
-
121
-
122
-
123
-
124
-
125
-
126
-
127
-
128
-
129
-
130
-
131
-
132
-
133
-
134
-
135
-
136
-
137
-
138
-
139
-
140
-
141
-
142
-
143
-
144
-
145
-
146
-
147
-
148
-
149
-
150
-
151
-
152
-
153
-
154
-
155
-
156
-
157
-
158
-
159
-
160
-
161
-
162
-
163
-
164
-
165
-
166
-
167
-
168
-
169
-
170
-
171
-
172
-
173
-
174
-
175
-
176
-
177
-
178
-
179
-
180
-
181
-
182
-
183
-
184
-
185
-
186
-
187
-
188
-
189
-
190
-
191
-
192
-
193
-
194
-
195
 |
 |

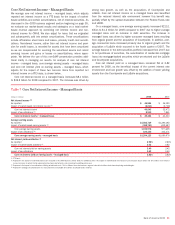
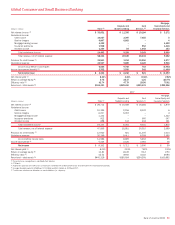
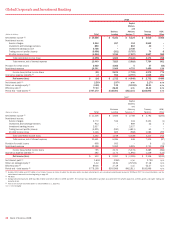
Global Consumer and Small Business Banking
2008
(Dollars in millions) Total
(1)
Deposits and
Student Lending
Card
Services
(1)
Mortgage,
Home Equity and
Insurance Services
Net interest income
(2)
$ 33,851 $ 11,395 $ 19,184 $ 3,272
Noninterest income:
Card income
10,057 2,397 7,655 5
Service charges
6,807 6,803 – 4
Mortgage banking income
4,422 – – 4,422
Insurance premiums
1,968 – 552 1,416
All other income
1,239 54 1,042 143
Total noninterest income
24,493 9,254 9,249 5,990
Total revenue, net of interest expense
58,344 20,649 28,433 9,262
Provision for credit losses
(3)
26,841 1,014 19,550 6,277
Noninterest expense
24,937 9,869 8,120 6,948
Income (loss) before income taxes
6,566 9,766 763 (3,963)
Income tax expense (benefit)
(2)
2,332 3,556 242 (1,466)
Net income (loss)
$ 4,234 $ 6,210 $ 521 $ (2,497)
Net interest yield
(2)
8.43% 3.23% 8.36% 2.52%
Return on average equity
(4)
5.78 28.37 1.25 (25.79)
Efficiency ratio
(2)
42.74 47.79 28.56 75.02
Period end – total assets
(5)
$511,401 $389,450 $249,676 $205,386
2007
(Dollars in millions) Total
(1)
Deposits and
Student Lending
Card
Services
(1)
Mortgage,
Home Equity and
Insurance Services
Net interest income
(2)
$ 28,712 $ 10,549 $ 16,284 $ 1,879
Noninterest income:
Card income 10,194 2,156 8,032 6
Service charges 6,007 6,003 – 4
Mortgage banking income 1,332 – – 1,332
Insurance premiums 912 – 565 347
All other income 698 143 434 121
Total noninterest income 19,143 8,302 9,031 1,810
Total revenue, net of interest expense 47,855 18,851 25,315 3,689
Provision for credit losses
(3)
12,920 601 11,305 1,014
Noninterest expense 20,349 9,411 8,358 2,580
Income before income taxes 14,586 8,839 5,652 95
Income tax expense
(2)
5,224 3,126 2,062 36
Net income $ 9,362 $ 5,713 $ 3,590 $ 59
Net interest yield
(2)
8.03% 3.19% 7.80% 2.35%
Return on average equity
(4)
14.81 26.49 9.13 2.50
Efficiency ratio
(2)
42.52 49.93 33.02 69.93
Period end – total assets
(5)
$445,319 $380,934 $254,356 $100,992
(1) Presented on a managed basis, specifically Card Services.
(2) FTE basis
(3) Represents provision for credit losses on held loans combined with realized credit losses associated with the securitized loan portfolio.
(4) Average allocated equity for GCSBB was $73.3 billion and $63.2 billion in 2008 and 2007.
(5) Total assets include asset allocations to match liabilities (i.e., deposits).
Bank of America 2008
33