Bank of America 2008 Annual Report Download - page 137
Download and view the complete annual report
Please find page 137 of the 2008 Bank of America annual report below. You can navigate through the pages in the report by either clicking on the pages listed below, or by using the keyword search tool below to find specific information within the annual report.-
 1
1 -
2
-
3
-
4
-
5
-
6
-
7
-
8
-
9
-
10
-
11
-
12
-
13
-
14
-
15
-
16
-
17
-
18
-
19
-
20
-
21
-
22
-
23
-
24
-
25
-
26
-
27
-
28
-
29
-
30
-
31
-
32
-
33
-
34
-
35
-
36
-
37
-
38
-
39
-
40
-
41
-
42
-
43
-
44
-
45
-
46
-
47
-
48
-
49
-
50
-
51
-
52
-
53
-
54
-
55
-
56
-
57
-
58
-
59
-
60
-
61
-
62
-
63
-
64
-
65
-
66
-
67
-
68
-
69
-
70
-
71
-
72
-
73
-
74
-
75
-
76
-
77
-
78
-
79
-
80
-
81
-
82
-
83
-
84
-
85
-
86
-
87
-
88
-
89
-
90
-
91
-
92
-
93
-
94
-
95
-
96
-
97
-
98
-
99
-
100
-
101
-
102
-
103
-
104
-
105
-
106
-
107
-
108
-
109
-
110
-
111
-
112
-
113
-
114
-
115
-
116
-
117
-
118
-
119
-
120
-
121
-
122
-
123
-
124
-
125
-
126
-
 127
127 -
 128
128 -
 129
129 -
 130
130 -
 131
131 -
 132
132 -
 133
133 -
 134
134 -
 135
135 -
 136
136 -
 137
137 -
 138
138 -
 139
139 -
 140
140 -
 141
141 -
 142
142 -
 143
143 -
 144
144 -
 145
145 -
 146
146 -
 147
147 -
148
-
149
-
150
-
151
-
152
-
153
-
154
-
155
-
156
-
157
-
158
-
159
-
160
-
161
-
162
-
163
-
164
-
165
-
166
-
167
-
168
-
169
-
170
-
171
-
172
-
173
-
174
-
175
-
176
-
177
-
178
-
179
-
180
-
181
-
182
-
183
-
184
-
185
-
186
-
187
-
188
-
189
-
190
-
191
-
192
-
193
-
194
-
195
 |
 |

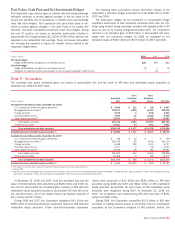
Fair Value, Cash Flow and Net Investment Hedges
The Corporation uses various types of interest rate and foreign exchange
derivative contracts to protect against changes in the fair value of its
assets and liabilities due to fluctuations in interest rates and exchange
rates (fair value hedges). The Corporation also uses these types of con-
tracts to protect against changes in the cash flows of its assets and
liabilities, and other forecasted transactions (cash flow hedges). During
the next 12 months, net losses on derivative instruments included in
accumulated OCI of approximately $1.2 billion ($786 million after-tax) are
expected to be reclassified into earnings. These net losses reclassified
into earnings are expected to reduce net interest income related to the
respective hedged items.
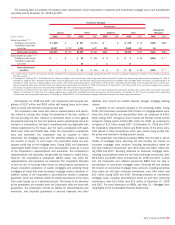
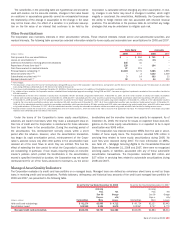
The following table summarizes certain information related to the
Corporation’s derivative hedges accounted for under SFAS 133 for 2008,
2007 and 2006.
The Corporation hedges its net investment in consolidated foreign
operations determined to have functional currencies other than the U.S.
dollar using forward foreign exchange contracts that typically settle in 90
days as well as by issuing foreign-denominated debt. The Corporation
recorded a net derivative gain of $2.8 billion in accumulated OCI asso-
ciated with net investment hedges for 2008 as compared to net
derivative losses of $516 million and $475 million for 2007 and 2006.
(Dollars in millions) 2008 2007 2006
Fair value hedges
Hedge ineffectiveness recognized in net interest income
$28
$55 $23
Cash flow hedges
Hedge ineffectiveness recognized in net interest income
(7)
418
Net gains on transactions which are probable of not occurring recognized in other income
–
18 –
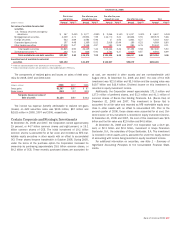
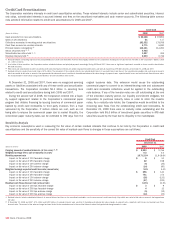
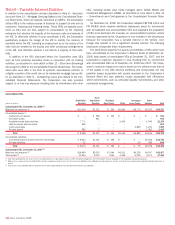
Note 5 – Securities
The amortized cost, gross unrealized gains and losses in accumulated OCI, and fair value of AFS debt and marketable equity securities at
December 31, 2008 and 2007 were:
(Dollars in millions)
Amortized
Cost
Gross
Unrealized
Gains
Gross
Unrealized
Losses Fair Value
Available-for-sale debt securities, December 31, 2008
U.S. Treasury securities and agency debentures
$ 4,540 $ 121 $ (14) $ 4,647
Mortgage-backed securities
(1)
235,137 3,924 (9,483) 229,578
Foreign securities
5,675 6 (678) 5,003
Corporate/Agency bonds
5,560 31 (1,022) 4,569
Other taxable securities
(2)
24,832 11 (1,300) 23,543
Total taxable securities
275,744 4,093 (12,497) 267,340
Tax-exempt securities
10,501 44 (981) 9,564
Total available-for-sale debt securities
$286,245 $ 4,137 $(13,478) $276,904
Available-for-sale marketable equity securities (3)
$ 18,892 $ 7,717 $ (1,537) $ 25,072
Available-for-sale debt securities, December 31, 2007
U.S. Treasury securities and agency debentures $ 749 $ 10 $ – $ 759
Mortgage-backed securities
(1)
166,768 92 (3,144) 163,716
Foreign securities 6,568 290 (101) 6,757
Corporate/Agency bonds 3,107 2 (76) 3,033
Other taxable securities
(2)
24,608 69 (84) 24,593
Total taxable securities 201,800 463 (3,405) 198,858
Tax-exempt securities 14,468 73 (69) 14,472
Total available-for-sale debt securities $216,268 $ 536 $ (3,474) $213,330
Available-for-sale marketable equity securities (3) $ 6,562 $13,530 $ (352) $ 19,740
(1) The majority of securities were issued by U.S. government-backed or government-sponsored enterprises.
(2) Includes ABS.
(3) Represents those AFS marketable equity securities that are recorded in other assets on the Consolidated Balance Sheet. At December 31, 2008 and 2007, approximately $19.7 billion and $16.2 billion of the fair
value balance, including $7.7 billion and $13.4 billion of unrealized gain, represents China Construction Bank (CCB) shares.
At December 31, 2008 and 2007, both the amortized cost and fair
value of held-to-maturity debt securities was $685 million and $726 mil-
lion and the accumulated net unrealized gains (losses) on AFS debt and
marketable equity securities included in accumulated OCI were $(2.0) bil-
lion and $6.6 billion, net of the related income tax expense (benefit) of
$(1.1) billion and $3.7 billion.
During 2008 and 2007, the Corporation recognized $4.1 billion and
$398 million of other-than-temporary impairment losses on AFS debt and
marketable equity securities. These other-than-temporary impairment
losses were comprised of $3.5 billion and $398 million on AFS debt
securities during 2008 and 2007 and $661 million on AFS marketable
equity securities during 2008. No such losses on AFS marketable equity
securities were recognized during 2007. At December 31, 2008 and
2007, the Corporation had nonperforming AFS debt securities of $291
million and $180 million.
During 2008, the Corporation reclassified $12.6 billion of AFS debt
securities to trading account assets in connection with the Countrywide
acquisition as the Corporation realigned its AFS portfolio. Further, the
Bank of America 2008
135