Bank of America 2008 Annual Report Download - page 190
Download and view the complete annual report
Please find page 190 of the 2008 Bank of America annual report below. You can navigate through the pages in the report by either clicking on the pages listed below, or by using the keyword search tool below to find specific information within the annual report.-
 1
1 -
2
-
3
-
4
-
5
-
6
-
7
-
8
-
9
-
10
-
11
-
12
-
13
-
14
-
15
-
16
-
17
-
18
-
19
-
20
-
21
-
22
-
23
-
24
-
25
-
26
-
27
-
28
-
29
-
30
-
31
-
32
-
33
-
34
-
35
-
36
-
37
-
38
-
39
-
40
-
41
-
42
-
43
-
44
-
45
-
46
-
47
-
48
-
49
-
50
-
51
-
52
-
53
-
54
-
55
-
56
-
57
-
58
-
59
-
60
-
61
-
62
-
63
-
64
-
65
-
66
-
67
-
68
-
69
-
70
-
71
-
72
-
73
-
74
-
75
-
76
-
77
-
78
-
79
-
80
-
81
-
82
-
83
-
84
-
85
-
86
-
87
-
88
-
89
-
90
-
91
-
92
-
93
-
94
-
95
-
96
-
97
-
98
-
99
-
100
-
101
-
102
-
103
-
104
-
105
-
106
-
107
-
108
-
109
-
110
-
111
-
112
-
113
-
114
-
115
-
116
-
117
-
118
-
119
-
120
-
121
-
122
-
123
-
124
-
125
-
126
-
127
-
128
-
129
-
130
-
131
-
132
-
133
-
134
-
135
-
136
-
137
-
138
-
139
-
140
-
141
-
142
-
143
-
144
-
145
-
146
-
147
-
148
-
149
-
150
-
151
-
152
-
153
-
154
-
155
-
156
-
157
-
158
-
159
-
160
-
161
-
162
-
163
-
164
-
165
-
166
-
167
-
168
-
169
-
170
-
171
-
172
-
173
-
174
-
175
-
176
-
177
-
178
-
179
-
 180
180 -
 181
181 -
 182
182 -
 183
183 -
 184
184 -
 185
185 -
 186
186 -
 187
187 -
 188
188 -
 189
189 -
 190
190 -
 191
191 -
 192
192 -
 193
193 -
 194
194 -
 195
195
 |
 |

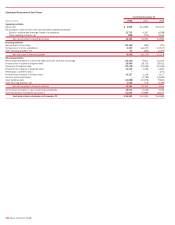
Condensed Statement of Cash Flows
Year Ended December 31
(Dollars in millions)
2008
2007 2006
Operating activities
Net income
$ 4,008
$ 14,982 $ 21,133
Reconciliation of net income to net cash provided by operating activities:
Equity in undistributed (earnings) losses of subsidiaries
12,715
4,247 (6,598)
Other operating activities, net
(598)
(276) 2,159
Net cash provided by operating activities
16,125
18,953 16,694
Investing activities
Net purchases of securities
(12,142)
(839) (705)
Net payments from (to) subsidiaries
2,490
(44,457) (13,673)
Other investing activities, net
43
(824) (1,300)
Net cash used in investing activities
(9,609)
(46,120) (15,678)
Financing activities
Net increase (decrease) in commercial paper and other short-term borrowings
(14,131)
8,873 12,519
Proceeds from issuance of long-term debt
28,994
38,730 28,412
Retirement of long-term debt
(13,178)
(12,056) (15,506)
Proceeds from issuance of preferred stock
34,742
1,558 2,850
Redemption of preferred stock
–
– (270)
Proceeds from issuance of common stock
10,127
1,118 3,117
Common stock repurchased
–
(3,790) (14,359)
Cash dividends paid
(11,528)
(10,878) (9,661)
Other financing activities, net
5,030
576 (2,799)
Net cash provided by financing activities
40,056
24,131 4,303
Net increase (decrease) in cash held at bank subsidiaries
46,572
(3,036) 5,319
Cash held at bank subsidiaries at January 1
51,953
54,989 49,670
Cash held at bank subsidiaries at December 31
$ 98,525
$ 51,953 $ 54,989
188
Bank of America 2008