Bank of America 2008 Annual Report Download - page 181
Download and view the complete annual report
Please find page 181 of the 2008 Bank of America annual report below. You can navigate through the pages in the report by either clicking on the pages listed below, or by using the keyword search tool below to find specific information within the annual report.-
 1
1 -
2
-
3
-
4
-
5
-
6
-
7
-
8
-
9
-
10
-
11
-
12
-
13
-
14
-
15
-
16
-
17
-
18
-
19
-
20
-
21
-
22
-
23
-
24
-
25
-
26
-
27
-
28
-
29
-
30
-
31
-
32
-
33
-
34
-
35
-
36
-
37
-
38
-
39
-
40
-
41
-
42
-
43
-
44
-
45
-
46
-
47
-
48
-
49
-
50
-
51
-
52
-
53
-
54
-
55
-
56
-
57
-
58
-
59
-
60
-
61
-
62
-
63
-
64
-
65
-
66
-
67
-
68
-
69
-
70
-
71
-
72
-
73
-
74
-
75
-
76
-
77
-
78
-
79
-
80
-
81
-
82
-
83
-
84
-
85
-
86
-
87
-
88
-
89
-
90
-
91
-
92
-
93
-
94
-
95
-
96
-
97
-
98
-
99
-
100
-
101
-
102
-
103
-
104
-
105
-
106
-
107
-
108
-
109
-
110
-
111
-
112
-
113
-
114
-
115
-
116
-
117
-
118
-
119
-
120
-
121
-
122
-
123
-
124
-
125
-
126
-
127
-
128
-
129
-
130
-
131
-
132
-
133
-
134
-
135
-
136
-
137
-
138
-
139
-
140
-
141
-
142
-
143
-
144
-
145
-
146
-
147
-
148
-
149
-
150
-
151
-
152
-
153
-
154
-
155
-
156
-
157
-
158
-
159
-
160
-
161
-
162
-
163
-
164
-
165
-
166
-
167
-
168
-
169
-
170
-
 171
171 -
 172
172 -
 173
173 -
 174
174 -
 175
175 -
 176
176 -
 177
177 -
 178
178 -
 179
179 -
 180
180 -
 181
181 -
 182
182 -
 183
183 -
 184
184 -
 185
185 -
 186
186 -
 187
187 -
 188
188 -
 189
189 -
 190
190 -
 191
191 -
192
-
193
-
194
-
195
 |
 |

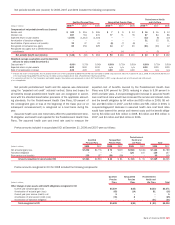
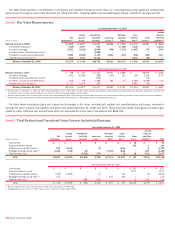
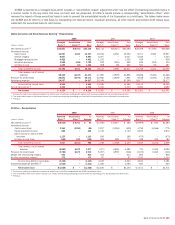
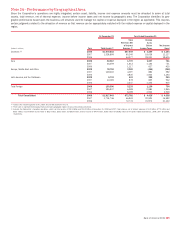
The table below summarizes changes in unrealized gains or losses recorded in earnings during the years ended December 31, 2008 and 2007 for
Level 3 assets and liabilities that were still held at December 31, 2008 and 2007. These amounts include changes in fair value of loans, LHFS and
loan commitments which are accounted for at fair value in accordance with SFAS 159.
Level 3 Changes in Unrealized Gains (Losses) Relating to Assets and Liabilities Still Held at Reporting Date
Year Ended December 31, 2008
(Dollars in millions)
Net
Derivatives
Trading
Account
Assets
Available-for-
Sale Debt
Securities
Loans
and
Leases
(1)
Mortgage
Servicing
Rights
Loans
Held-for-
Sale
(1)
Other
Assets
Accrued
Expenses
and Other
Liabilities
(1)
Total
Card income (loss)
$–
$ – $ – $ – $ – $ – $(331) $ – $ (331)
Equity investment income (loss)
–
– – – – – (193) – (193)
Trading account profits (losses)
2,095
(2,144) – – – (154) – – (203)
Mortgage banking income (loss)
(2)
1,154
(178) (74) – (7,378) (423) – 292 (6,607)
Other income (loss)
–
– (1,840) (1,003) – (4) – (880) (3,727)
Total
$3,249
$ (2,322) $(1,914) $(1,003) $(7,378) $(581) $(524) $(588) $(11,061)
Year Ended December 31, 2007
Card income (loss)
$–
$ – $ – $ – $ – $ – $(136) $ – $ (136)
Equity investment income (loss)
–
– – – – – (65) – (65)
Trading account profits (losses)
(196)
(2,857) – – – (58) – (1) (3,112)
Mortgage banking income (loss)
(2)
139
– – – (43) (22) – – 74
Other income (loss)
–
– (398) (167) – – – (395) (960)
Total
$ (57)
$(2,857) $ (398) $ (167) $ (43) $ (80) $(201) $(396) $ (4,199)
(1) Amounts represented items which are accounted for at fair value in accordance with SFAS 159.
(2) Mortgage banking income does not reflect impact of Level 1 and Level 2 hedges against MSRs.
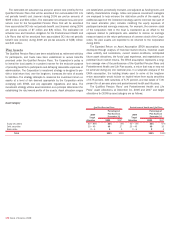
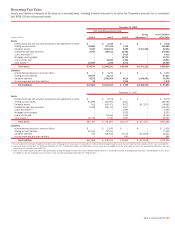
Non-recurring Fair Value
Certain assets and liabilities are measured at fair value on a non-recurring basis and are not included in the tables above. These assets and liabilities
primarily include LHFS, unfunded loan commitments held-for-sale, and foreclosed properties. The amounts below represent only balances measured at
fair value during the period and still held as of the reporting date.
Assets and Liabilities Measured at Fair Value on a Non-Recurring Basis
At and for the Year Ended
December 31, 2008
At and for the Year Ended
December 31, 2007
(Dollars in millions) Level 1 Level 2 Level 3 (Losses) Level 1 Level 2 Level 3 (Losses)
Assets
Loans held-for-sale
$–
$1,828 $9,782 $(1,699) $– $1,200 $13,300 $(172)
Foreclosed properties
(1)
–
– 590 (171) – – 155 (17)
Liabilities
Accrued expenses and other liabilities
–
–– –– – 142 (145)
(1) Amounts are included in other assets on the Consolidated Balance Sheet and represent fair value and related losses of foreclosed properties that were written down subsequent to their initial classification as
foreclosed properties.
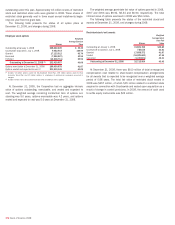
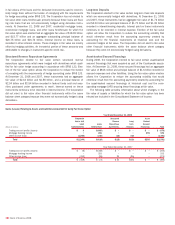
Fair Value Option Elections
Corporate Loans and Loan Commitments
The Corporation elected to account for certain large corporate loans and
loan commitments which exceeded the Corporation’s single name credit
risk concentration guidelines at fair value in accordance with SFAS 159.
Lending commitments, both funded and unfunded, are actively managed
and monitored, and, as appropriate, credit risk for these lending relation-
ships may be mitigated through the use of credit derivatives, with the
Corporation’s credit view and market perspectives determining the size
and timing of the hedging activity. These credit derivatives do not meet
the requirements for hedge accounting under SFAS 133 and are therefore
carried at fair value with changes in fair value recorded in other income.
Electing the fair value option allows the Corporation to account for these
loans and loan commitments at fair value, which is more consistent with
management’s view of the underlying economics and the manner in which
they are managed. In addition, accounting for these loans and loan
commitments at fair value reduces the accounting asymmetry that would
otherwise result from carrying the loans at historical cost and the credit
derivatives at fair value.
At December 31, 2008 and 2007, funded loans which the Corporation
has elected to fair value had an aggregate fair value of $5.41 billion and
$4.59 billion recorded in loans and leases and an aggregate outstanding
principal balance of $6.42 billion and $4.82 billion. At December 31,
2008 and 2007, unfunded loan commitments that the Corporation has
elected to fair value had an aggregate fair value of $1.12 billion and
$660 million recorded in accrued expenses and other liabilities and an
aggregate committed exposure of $16.9 billion and $20.9 billion. Interest
income on these loans is recorded in interest and fees on loans and
leases. At December 31, 2008 and 2007, none of these loans were 90
days or more past due and still accruing interest or had been placed on
nonaccrual status.
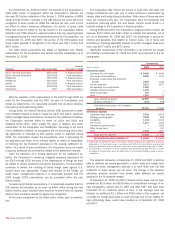
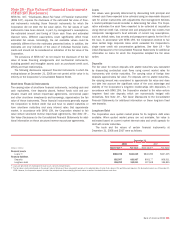
Loans Held-for-Sale
The Corporation also elected to account for certain loans held-for-sale at
fair value. Electing to use fair value allows a better offset of the changes
Bank of America 2008
179