Bank of America 2008 Annual Report Download - page 189
Download and view the complete annual report
Please find page 189 of the 2008 Bank of America annual report below. You can navigate through the pages in the report by either clicking on the pages listed below, or by using the keyword search tool below to find specific information within the annual report.-
 1
1 -
2
-
3
-
4
-
5
-
6
-
7
-
8
-
9
-
10
-
11
-
12
-
13
-
14
-
15
-
16
-
17
-
18
-
19
-
20
-
21
-
22
-
23
-
24
-
25
-
26
-
27
-
28
-
29
-
30
-
31
-
32
-
33
-
34
-
35
-
36
-
37
-
38
-
39
-
40
-
41
-
42
-
43
-
44
-
45
-
46
-
47
-
48
-
49
-
50
-
51
-
52
-
53
-
54
-
55
-
56
-
57
-
58
-
59
-
60
-
61
-
62
-
63
-
64
-
65
-
66
-
67
-
68
-
69
-
70
-
71
-
72
-
73
-
74
-
75
-
76
-
77
-
78
-
79
-
80
-
81
-
82
-
83
-
84
-
85
-
86
-
87
-
88
-
89
-
90
-
91
-
92
-
93
-
94
-
95
-
96
-
97
-
98
-
99
-
100
-
101
-
102
-
103
-
104
-
105
-
106
-
107
-
108
-
109
-
110
-
111
-
112
-
113
-
114
-
115
-
116
-
117
-
118
-
119
-
120
-
121
-
122
-
123
-
124
-
125
-
126
-
127
-
128
-
129
-
130
-
131
-
132
-
133
-
134
-
135
-
136
-
137
-
138
-
139
-
140
-
141
-
142
-
143
-
144
-
145
-
146
-
147
-
148
-
149
-
150
-
151
-
152
-
153
-
154
-
155
-
156
-
157
-
158
-
159
-
160
-
161
-
162
-
163
-
164
-
165
-
166
-
167
-
168
-
169
-
170
-
171
-
172
-
173
-
174
-
175
-
176
-
177
-
178
-
 179
179 -
 180
180 -
 181
181 -
 182
182 -
 183
183 -
 184
184 -
 185
185 -
 186
186 -
 187
187 -
 188
188 -
 189
189 -
 190
190 -
 191
191 -
 192
192 -
 193
193 -
 194
194 -
 195
195
 |
 |

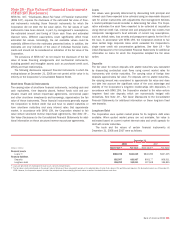
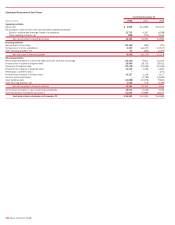
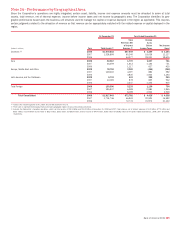
Note 23 – Parent Company Information
The following tables present the Parent Company Only financial information:
Condensed Statement of Income
Year Ended December 31
(Dollars in millions)
2008
2007 2006
Income
Dividends from subsidiaries:
Bank holding companies and related subsidiaries
$ 18,178
$20,615 $15,950
Nonbank companies and related subsidiaries
1,026
181 111
Interest from subsidiaries
3,433
4,939 3,944
Other income
940
3,319 2,346
Total income
23,577
29,054 22,351
Expense
Interest on borrowed funds
6,818
7,834 5,799
Noninterest expense
1,829
3,127 3,019
Total expense
8,647
10,961 8,818
Income before income taxes and equity in undistributed earnings of subsidiaries
14,930
18,093 13,533
Income tax benefit
1,793
1,136 1,002
Income before equity in undistributed earnings of subsidiaries
16,723
19,229 14,535
Equity in undistributed earnings (losses) of subsidiaries:
Bank holding companies and related subsidiaries
(11,221)
(4,497) 5,613
Nonbank companies and related subsidiaries
(1,494)
250 985
Total equity in undistributed earnings (losses) of subsidiaries
(12,715)
(4,247) 6,598
Net income
$ 4,008
$14,982 $21,133
Net income available to common shareholders
$ 2,556
$14,800 $21,111
Condensed Balance Sheet
December 31
(Dollars in millions)
2008
2007
Assets
Cash held at bank subsidiaries
$ 98,525
$ 51,953
Debt securities
16,241
3,198
Receivables from subsidiaries:
Bank holding companies and related subsidiaries
39,239
30,032
Nonbank companies and related subsidiaries
23,518
33,637
Investments in subsidiaries:
Bank holding companies and related subsidiaries
172,460
181,248
Nonbank companies and related subsidiaries
20,355
6,935
Other assets
20,428
30,919
Total assets
$390,766
$337,922
Liabilities and shareholders’ equity
Commercial paper and other short-term borrowings
$ 26,536
$ 40,667
Accrued expenses and other liabilities
15,244
13,226
Payables to subsidiaries:
Bank holding companies and related subsidiaries
469
1,464
Nonbank companies and related subsidiaries
3
—
Long-term debt
171,462
135,762
Shareholders’ equity
177,052
146,803
Total liabilities and shareholders’ equity
$390,766
$337,922
Bank of America 2008
187