Bank of America 2008 Annual Report Download - page 29
Download and view the complete annual report
Please find page 29 of the 2008 Bank of America annual report below. You can navigate through the pages in the report by either clicking on the pages listed below, or by using the keyword search tool below to find specific information within the annual report.-
 1
1 -
2
-
3
-
4
-
5
-
6
-
7
-
8
-
9
-
10
-
11
-
12
-
13
-
14
-
15
-
16
-
17
-
18
-
 19
19 -
 20
20 -
 21
21 -
 22
22 -
 23
23 -
 24
24 -
 25
25 -
 26
26 -
 27
27 -
 28
28 -
 29
29 -
 30
30 -
 31
31 -
 32
32 -
 33
33 -
 34
34 -
 35
35 -
 36
36 -
 37
37 -
 38
38 -
 39
39 -
40
-
41
-
42
-
43
-
44
-
45
-
46
-
47
-
48
-
49
-
50
-
51
-
52
-
53
-
54
-
55
-
56
-
57
-
58
-
59
-
60
-
61
-
62
-
63
-
64
-
65
-
66
-
67
-
68
-
69
-
70
-
71
-
72
-
73
-
74
-
75
-
76
-
77
-
78
-
79
-
80
-
81
-
82
-
83
-
84
-
85
-
86
-
87
-
88
-
89
-
90
-
91
-
92
-
93
-
94
-
95
-
96
-
97
-
98
-
99
-
100
-
101
-
102
-
103
-
104
-
105
-
106
-
107
-
108
-
109
-
110
-
111
-
112
-
113
-
114
-
115
-
116
-
117
-
118
-
119
-
120
-
121
-
122
-
123
-
124
-
125
-
126
-
127
-
128
-
129
-
130
-
131
-
132
-
133
-
134
-
135
-
136
-
137
-
138
-
139
-
140
-
141
-
142
-
143
-
144
-
145
-
146
-
147
-
148
-
149
-
150
-
151
-
152
-
153
-
154
-
155
-
156
-
157
-
158
-
159
-
160
-
161
-
162
-
163
-
164
-
165
-
166
-
167
-
168
-
169
-
170
-
171
-
172
-
173
-
174
-
175
-
176
-
177
-
178
-
179
-
180
-
181
-
182
-
183
-
184
-
185
-
186
-
187
-
188
-
189
-
190
-
191
-
192
-
193
-
194
-
195
 |
 |
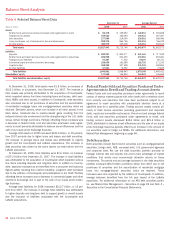
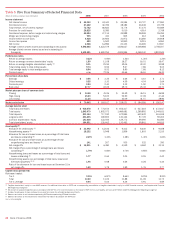
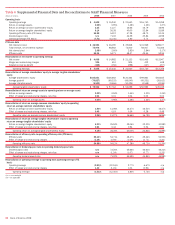
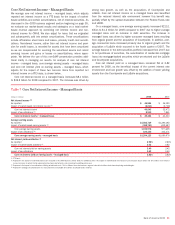
Loans and Leases, Net of Allowance for Loan and
Lease Losses
Period end and average loans and leases, net of allowance for loan and
lease losses increased $43.6 billion to $908.4 billion and $127.0 billion
to $893.4 billion in 2008 compared to 2007 due to consumer and
commercial organic growth and the addition of Countrywide. The average
consumer loan and lease portfolio increased $64.2 billion primarily due
to organic growth and the addition of Countrywide. The average commer-
cial loan and lease portfolio increased $70.5 billion primarily due to
organic growth and the acquisition of LaSalle which occurred in the fourth
quarter of 2007. For a more detailed discussion of the loan portfolio and
the allowance for credit losses, see Credit Risk Management beginning
on page 61, Note 6 – Outstanding Loans and Leases and Note 7 – Allow-
ance for Credit Losses to the Consolidated Financial Statements.
All Other Assets
Period end all other assets increased $44.7 billion at December 31,
2008, an increase of 13 percent from December 31, 2007, driven primar-
ily by the acquisition of Countrywide, which impacted various line items,
including MSRs and LHFS. In addition, the increase was driven by higher
derivative assets due to mark-to-market gains resulting from the reduced
interest rate environment and the strengthening of the U.S. dollar versus
certain foreign currencies.
Deposits
Period end and average deposits increased $77.8 billion to $883.0 bil-
lion and $114.0 billion to $831.1 billion in 2008 compared to 2007. The
average increase was due to a $95.3 billion increase in average domestic
interest-bearing deposits and a $19.4 billion increase in average
noninterest-bearing deposits. We categorize our deposits as core or
market-based deposits. Core deposits are generally customer-based and
represent a stable, low-cost funding source that usually reacts more
slowly to interest rate changes than market-based deposits. Core depos-
its include savings, NOW and money market accounts, consumer CDs
and IRAs, and noninterest-bearing deposits. Core deposits exclude nego-
tiable CDs, public funds, other domestic time deposits and foreign
interest-bearing deposits. Average core deposits increased $103.0 billion
to $696.9 billion in 2008, a 17 percent increase from the prior year. The
increase was attributable to growth in our average NOW and money mar-
ket accounts, average consumer CDs and IRAs and noninterest-bearing
deposits due to the addition of Countrywide and the benefit we received
from a consumer and business flight-to-safety resulting from market
instability. Average market-based deposit funding increased $11.0 billion
to $134.3 billion in 2008 compared to 2007 due to an increase in nego-
tiable CDs, public funds and other time deposits related to the funding of
growth in core and market-based assets. The increase in average depos-
its was also impacted by the assumption of deposits, primarily money
market, consumer CDs, and other domestic time deposits associated
with the LaSalle merger.
Federal Funds Purchased and Securities Sold Under
Agreements to Repurchase and Trading Account
Liabilities
Federal funds purchased and securities sold under agreements to
repurchase consist of deposits borrowed from other banks with a rela-
tively short-term maturity and securities that have been sold subject to an
agreement to repurchase securities with substantially identical terms at a
specified date for a specified price. Trading account liabilities consist
primarily of short positions in fixed income securities (including govern-
ment and corporate debt), equity and convertible instruments. Period end
federal funds purchased and securities sold under agreements to
repurchase, and trading account liabilities decreased $34.9 billion primar-
ily due to the rebalancing of hedges for market movements and lower
customer demand, and by the sale of our equity prime brokerage busi-
ness. Average federal funds purchased and securities sold under agree-
ments to repurchase, and trading account liabilities increased $12.0
billion primarily due to the relative low cost and availability of short-term
funding.
Commercial Paper and Other Short-term Borrowings
Commercial paper and other short-term borrowings provide a funding
source to supplement deposits in our ALM strategy. Period end commer-
cial paper and other short-term borrowings decreased $33.0 billion to
$158.1 billion in 2008 compared to 2007 due in part to the sale of our
equity prime brokerage business. Average commercial paper and other
short-term borrowings increased $11.4 billion to $182.7 billion in 2008
due to an increase in short-term funding given the change in market con-
ditions, partially offset by the sale of our equity prime brokerage busi-
ness.
Long-term Debt
Period end and average long-term debt increased $70.8 billion to $268.3
billion and $61.4 billion to $231.2 billion in 2008 compared to 2007.
The increases were attributable to issuances to support growth in overall
assets and enhance our liquidity, and the inclusion of long-term debt
associated with the Countrywide acquisition. Period end balances also
benefited from our participation in the TLGP and average balances bene-
fited from the LaSalle acquisition. For additional information on the TLGP,
see Regulatory Initiatives on page 20. For additional information on long-
term debt, see Note 12 – Short-term Borrowings and Long-term Debt to
the Consolidated Financial Statements.
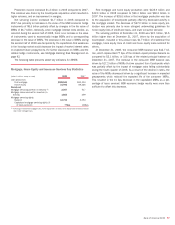
Shareholders’ Equity
Period end shareholders’ equity increased $30.2 billion due to the issu-
ance of preferred stock including $15.0 billion to the U.S. Treasury in
connection with the TARP Capital Purchase Program, a common stock
offering of $9.9 billion, $4.2 billion of common stock issued in con-
nection with the Countrywide acquisition, and net income. These
increases were partially offset by a decrease in accumulated OCI and
higher preferred dividend payments. The decrease in accumulated OCI
was due to unrealized losses incurred on our debt and marketable equity
securities and the adverse impact of employee benefit plan adjustments
driven by the difference between the assumed and actual rate of return
on benefit plan assets during the year. For additional information on our
employee benefit plans, see Note 16 – Employee Benefit Plans to the
Consolidated Financial Statements. Average shareholders’ equity
increased $28.2 billion due to the same period end factors discussed
above, except accumulated OCI benefited from the fair value adjustment
related to our investment in China Construction Bank (CCB) which we
began to fair value in the fourth quarter of 2007.
Bank of America 2008
27