Bank of America 2008 Annual Report Download - page 31
Download and view the complete annual report
Please find page 31 of the 2008 Bank of America annual report below. You can navigate through the pages in the report by either clicking on the pages listed below, or by using the keyword search tool below to find specific information within the annual report.-
 1
1 -
2
-
3
-
4
-
5
-
6
-
7
-
8
-
9
-
10
-
11
-
12
-
13
-
14
-
15
-
16
-
17
-
18
-
19
-
20
-
 21
21 -
 22
22 -
 23
23 -
 24
24 -
 25
25 -
 26
26 -
 27
27 -
 28
28 -
 29
29 -
 30
30 -
 31
31 -
 32
32 -
 33
33 -
 34
34 -
 35
35 -
 36
36 -
 37
37 -
 38
38 -
 39
39 -
 40
40 -
 41
41 -
42
-
43
-
44
-
45
-
46
-
47
-
48
-
49
-
50
-
51
-
52
-
53
-
54
-
55
-
56
-
57
-
58
-
59
-
60
-
61
-
62
-
63
-
64
-
65
-
66
-
67
-
68
-
69
-
70
-
71
-
72
-
73
-
74
-
75
-
76
-
77
-
78
-
79
-
80
-
81
-
82
-
83
-
84
-
85
-
86
-
87
-
88
-
89
-
90
-
91
-
92
-
93
-
94
-
95
-
96
-
97
-
98
-
99
-
100
-
101
-
102
-
103
-
104
-
105
-
106
-
107
-
108
-
109
-
110
-
111
-
112
-
113
-
114
-
115
-
116
-
117
-
118
-
119
-
120
-
121
-
122
-
123
-
124
-
125
-
126
-
127
-
128
-
129
-
130
-
131
-
132
-
133
-
134
-
135
-
136
-
137
-
138
-
139
-
140
-
141
-
142
-
143
-
144
-
145
-
146
-
147
-
148
-
149
-
150
-
151
-
152
-
153
-
154
-
155
-
156
-
157
-
158
-
159
-
160
-
161
-
162
-
163
-
164
-
165
-
166
-
167
-
168
-
169
-
170
-
171
-
172
-
173
-
174
-
175
-
176
-
177
-
178
-
179
-
180
-
181
-
182
-
183
-
184
-
185
-
186
-
187
-
188
-
189
-
190
-
191
-
192
-
193
-
194
-
195
 |
 |
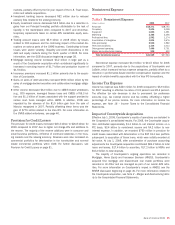
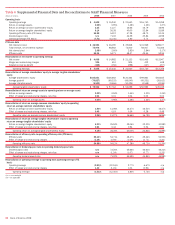
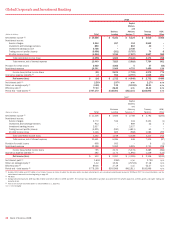
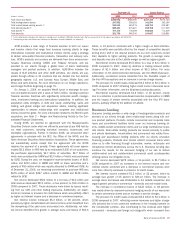
Supplemental Financial Data
Table 6 provides a reconciliation of the supplemental financial data men-
tioned below with financial measures defined by GAAP. Other companies
may define or calculate supplemental financial data differently.
Operating Basis Presentation
In managing our business, we may at times look at performance exclud-
ing certain nonrecurring items. For example, as an alternative to net
income, we view results on an operating basis, which represents net
income excluding merger and restructuring charges. The operating basis
of presentation is not defined by GAAP. We believe that the exclusion of
merger and restructuring charges, which represent events outside our
normal operations, provides a meaningful year-to-year comparison and is
more reflective of normalized operations.
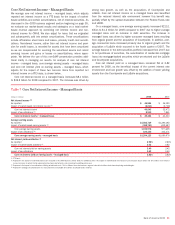
Net Interest Income – FTE Basis
In addition, we view net interest income and related ratios and analysis
(i.e., efficiency ratio, net interest yield and operating leverage) on a FTE
basis. Although this is a non-GAAP measure, we believe managing the
business with net interest income on a FTE basis provides a more accu-
rate picture of the interest margin for comparative purposes. To derive the
FTE basis, net interest income is adjusted to reflect tax-exempt income
on an equivalent before-tax basis with a corresponding increase in
income tax expense. For purposes of this calculation, we use the federal
statutory tax rate of 35 percent. This measure ensures comparability of
net interest income arising from taxable and tax-exempt sources.
Performance Measures
As previously mentioned, certain performance measures including the
efficiency ratio, net interest yield and operating leverage utilize net inter-
est income (and thus total revenue) on a FTE basis. The efficiency ratio
measures the costs expended to generate a dollar of revenue, and net
interest yield evaluates how many basis points we are earning over the
cost of funds. Operating leverage measures the total percentage revenue
growth minus the total percentage expense growth for the corresponding
period. During our annual planning process, we set operating leverage
and efficiency targets for the Corporation and each line of business. We
believe the use of these non-GAAP measures provides additional clarity in
assessing our results. Targets vary by year and by business, and are
based on a variety of factors including maturity of the business, invest-
ment appetite, competitive environment, market factors, and other items
(e.g., risk appetite). The aforementioned performance measures and
ratios, return on average assets and dividend payout ratio, as well as
those measures discussed more fully below, are presented in Table 6.
Return on Average Common Shareholders’ Equity
and Return on Average Tangible Shareholders’
Equity
We also evaluate our business based upon ROE and ROTE measures.
ROE and ROTE utilize non-GAAP allocation methodologies. ROE measures
the earnings contribution of a unit as a percentage of the shareholders’
equity allocated to that unit. ROTE measures our earnings contribution as
a percentage of shareholders’ equity reduced by goodwill and intangible
assets (excluding MSRs). These measures are used to evaluate our use
of equity (i.e., capital) at the individual unit level and are integral compo-
nents in the analytics for resource allocation. In addition, profitability,
relationship, and investment models all use ROE as key measures to
support our overall growth goal.
Bank of America 2008
29