Bank of America 2008 Annual Report Download - page 73
Download and view the complete annual report
Please find page 73 of the 2008 Bank of America annual report below. You can navigate through the pages in the report by either clicking on the pages listed below, or by using the keyword search tool below to find specific information within the annual report.-
 1
1 -
2
-
3
-
4
-
5
-
6
-
7
-
8
-
9
-
10
-
11
-
12
-
13
-
14
-
15
-
16
-
17
-
18
-
19
-
20
-
21
-
22
-
23
-
24
-
25
-
26
-
27
-
28
-
29
-
30
-
31
-
32
-
33
-
34
-
35
-
36
-
37
-
38
-
39
-
40
-
41
-
42
-
43
-
44
-
45
-
46
-
47
-
48
-
49
-
50
-
51
-
52
-
53
-
54
-
55
-
56
-
57
-
58
-
59
-
60
-
61
-
62
-
 63
63 -
 64
64 -
 65
65 -
 66
66 -
 67
67 -
 68
68 -
 69
69 -
 70
70 -
 71
71 -
 72
72 -
 73
73 -
 74
74 -
 75
75 -
 76
76 -
 77
77 -
 78
78 -
 79
79 -
 80
80 -
 81
81 -
 82
82 -
 83
83 -
84
-
85
-
86
-
87
-
88
-
89
-
90
-
91
-
92
-
93
-
94
-
95
-
96
-
97
-
98
-
99
-
100
-
101
-
102
-
103
-
104
-
105
-
106
-
107
-
108
-
109
-
110
-
111
-
112
-
113
-
114
-
115
-
116
-
117
-
118
-
119
-
120
-
121
-
122
-
123
-
124
-
125
-
126
-
127
-
128
-
129
-
130
-
131
-
132
-
133
-
134
-
135
-
136
-
137
-
138
-
139
-
140
-
141
-
142
-
143
-
144
-
145
-
146
-
147
-
148
-
149
-
150
-
151
-
152
-
153
-
154
-
155
-
156
-
157
-
158
-
159
-
160
-
161
-
162
-
163
-
164
-
165
-
166
-
167
-
168
-
169
-
170
-
171
-
172
-
173
-
174
-
175
-
176
-
177
-
178
-
179
-
180
-
181
-
182
-
183
-
184
-
185
-
186
-
187
-
188
-
189
-
190
-
191
-
192
-
193
-
194
-
195
 |
 |

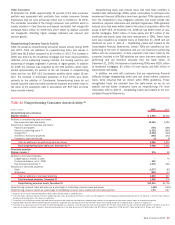
Commercial Credit Portfolio
Housing value declines, a slowdown in consumer spending and the tur-
moil in the global financial markets impacted our commercial portfolios
where we experienced higher levels of losses, particularly in the home-
builder sector of our commercial real estate portfolio. Broader-based
economic pressures have also impacted other commercial credit quality
indicators. The nonperforming loan and commercial utilized reservable
criticized exposure ratios were 1.93 percent and 8.90 percent at
December 31, 2008 compared to 0.67 percent and 4.46 percent at
December 31, 2007. Nonperforming loan increases were largely driven by
deterioration in the homebuilder portfolio. Utilized reservable criticized
increases were broad based across lines of business, products and
industries. The loans and leases net charge-off ratio increased to 1.07
percent in 2008 from 0.40 percent a year ago. Higher net charge-offs in
our small business portfolios within GCSBB reflected deterioration from
the impacts of a slowing economy particularly in geographic areas that
have experienced the most significant home price declines. Excluding
small business commercial – domestic the total net charge-off ratio was
0.52 percent compared to 0.07 percent in 2007. The increase was
mainly driven by higher net charge-offs in commercial real estate, princi-
pally the homebuilder loan portfolio, as well as commercial domestic and
foreign net charge-offs which were diverse in terms of both borrowers and
industries. The deterioration in the market accelerated during the later
stages of the fourth quarter.
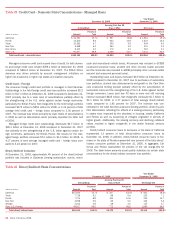
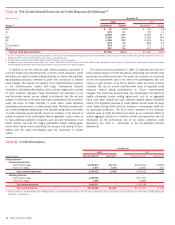
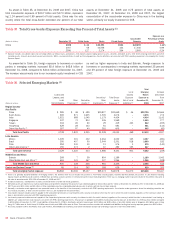
Table 25 presents our commercial loans and leases and related credit
quality information for 2008 and 2007.
Table 25 Commercial Loans and Leases
December 31 Year Ended December 31
Outstandings Nonperforming
(1)
Accruing Past Due
90 Days or More
(2)
Net Charge-offs
Net Charge-off
Ratios
(3)
(Dollars in millions) 2008 2007 2008 2007 2008 2007 2008 2007 2008 2007
Commercial loans and leases
Commercial – domestic
(4)
$200,088 $189,011 $2,040 $ 852 $ 381 $119 $ 519 $ 127 0.26% 0.08%
Commercial real estate 64,701 61,298 3,906 1,099 52 36 887 47 1.41 0.11
Commercial lease financing 22,400 22,582 56 33 23 25 60 20.27 0.01
Commercial – foreign 31,020 28,376 290 19 716 173 10.55 –
318,209 301,267 6,292 2,003 463 196 1,639 177 0.52 0.07
Small business commercial –
domestic
(5)
19,145 19,286 205 152 640 427 1,930 880 9.80 5.13
Total commercial loans and
leases excluding loans
measured at fair value 337,354 320,553 6,497 2,155 1,103 623 3,569 1,057 1.07 0.40
Total measured at fair value
(6)
5,413 4,590 ––––n/a n/a n/a n/a
Total commercial loans
and leases $342,767 $325,143 $6,497 $2,155 $1,103 $623 $3,569 $1,057 1.07 0.40
(1) Nonperforming commercial loans and leases as a percentage of outstanding commercial loans and leases excluding loans measured at fair value were 1.93 percent and 0.67 percent at December 31, 2008 and 2007.
(2) Accruing commercial loans and leases past due 90 days or more as a percentage of outstanding commercial loans and leases excluding loans measured at fair value were 0.33 percent and 0.19 percent at
December 31, 2008 and 2007.
(3) Net charge-off ratios are calculated as net charge-offs divided by average outstanding loans and leases excluding loans measured at fair value during the year for each loan and lease category.
(4) Excludes small business commercial – domestic loans.
(5) Small business commercial – domestic is primarily card related.
(6) Certain commercial loans are measured at fair value in accordance with SFAS 159 and include commercial – domestic loans of $3.5 billion at both December 31, 2008 and 2007, commercial – foreign loans of $1.7
billion and $790 million and commercial real estate loans of $203 million and $304 million at December 31, 2008 and 2007.
n/a = not applicable
Bank of America 2008
71