Bank of America 2008 Annual Report Download - page 65
Download and view the complete annual report
Please find page 65 of the 2008 Bank of America annual report below. You can navigate through the pages in the report by either clicking on the pages listed below, or by using the keyword search tool below to find specific information within the annual report.-
 1
1 -
2
-
3
-
4
-
5
-
6
-
7
-
8
-
9
-
10
-
11
-
12
-
13
-
14
-
15
-
16
-
17
-
18
-
19
-
20
-
21
-
22
-
23
-
24
-
25
-
26
-
27
-
28
-
29
-
30
-
31
-
32
-
33
-
34
-
35
-
36
-
37
-
38
-
39
-
40
-
41
-
42
-
43
-
44
-
45
-
46
-
47
-
48
-
49
-
50
-
51
-
52
-
53
-
54
-
 55
55 -
 56
56 -
 57
57 -
 58
58 -
 59
59 -
 60
60 -
 61
61 -
 62
62 -
 63
63 -
 64
64 -
 65
65 -
 66
66 -
 67
67 -
 68
68 -
 69
69 -
 70
70 -
 71
71 -
 72
72 -
 73
73 -
 74
74 -
 75
75 -
76
-
77
-
78
-
79
-
80
-
81
-
82
-
83
-
84
-
85
-
86
-
87
-
88
-
89
-
90
-
91
-
92
-
93
-
94
-
95
-
96
-
97
-
98
-
99
-
100
-
101
-
102
-
103
-
104
-
105
-
106
-
107
-
108
-
109
-
110
-
111
-
112
-
113
-
114
-
115
-
116
-
117
-
118
-
119
-
120
-
121
-
122
-
123
-
124
-
125
-
126
-
127
-
128
-
129
-
130
-
131
-
132
-
133
-
134
-
135
-
136
-
137
-
138
-
139
-
140
-
141
-
142
-
143
-
144
-
145
-
146
-
147
-
148
-
149
-
150
-
151
-
152
-
153
-
154
-
155
-
156
-
157
-
158
-
159
-
160
-
161
-
162
-
163
-
164
-
165
-
166
-
167
-
168
-
169
-
170
-
171
-
172
-
173
-
174
-
175
-
176
-
177
-
178
-
179
-
180
-
181
-
182
-
183
-
184
-
185
-
186
-
187
-
188
-
189
-
190
-
191
-
192
-
193
-
194
-
195
 |
 |

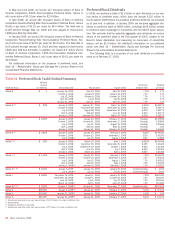
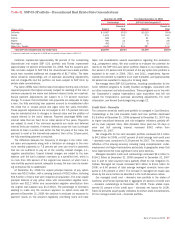
Table 16 Consumer Net Charge-offs/Net Losses and Related Ratios
Net Charge-offs/Losses Net Charge-off/Loss Ratios
(1, 2)
(Dollars in millions) 2008 2007 2008 2007
Held basis
Residential mortgage
$ 925
$56
0.36%
0.02%
Home equity
3,496
274
2.59
0.28
Discontinued real estate
16
n/a
0.15
n/a
Credit card – domestic
4,161
3,063
6.57
5.29
Credit card – foreign
551
379
3.34
3.06
Direct/Indirect consumer
3,114
1,373
3.77
1.96
Other consumer
399
278
10.46
6.18
Total held
$12,662
$5,423
2.21
1.07
Supplemental managed basis data
Credit card – domestic
$10,054
$6,960
6.60
4.91
Credit card – foreign
1,328
1,254
4.17
4.24
Total credit card – managed
$11,382
$8,214
6.18
4.79
(1) Net charge-off/loss ratios are calculated as held net charge-offs or managed net losses divided by average outstanding held or managed loans and leases during the year for each loan and lease category.
(2) Net charge-off ratios excluding the SOP 03-3 portfolio were 2.73 percent for home equity, 1.33 percent for discontinued real estate and 2.29 percent for the total held portfolio for 2008. These are the only product
classifications materially impacted by SOP 03-3 for 2008. For these loan and lease categories the dollar amounts of the net charge-offs were unchanged.
n/a = not applicable
Table 16 presents net charge-offs and related ratios for our consumer
loans and leases and net losses and related ratios for our managed
credit card portfolio for 2008 and 2007. The reported net charge-off
ratios for residential mortgage, home equity and discontinued real estate
benefit from the addition of the Countrywide SOP 03-3 portfolio as the
initial fair value adjustments recorded on those loans at acquisition would
have already included the estimated credit losses. The reported net
charge-offs for residential mortgage do not include the benefits of
amounts reimbursable under cash collateralized synthetic securitiza-
tions. Adjusting for the benefit of this credit protection, the residential
mortgage net charge-off ratio in 2008 would have been reduced by four
bps.
In certain cases, the inclusion of the SOP 03-3 portfolio, which was
written down to fair value at acquisition, may impact portfolio credit sta-
tistics and trends. We believe that the presentation of information
adjusted to exclude the impacts of the SOP 03-3 portfolio is more repre-
sentative of the ongoing operations and credit quality of the business. As
a result, in the discussions below of the residential mortgage, home
equity and discontinued real estate portfolios, we supplement certain
reported statistics with information that is adjusted to exclude the
impacts of the SOP 03-3 portfolio. In addition, beginning on page 65, we
separately disclose information on the SOP 03-3 portfolio.
Residential Mortgage
The residential mortgage portfolio, which excludes the discontinued real
estate portfolio acquired with Countrywide, makes up the largest percent-
age of our consumer loan portfolio at 42 percent of consumer loans and
leases (44 percent excluding the SOP 03-3 portfolio) at December 31,
2008. Approximately 14 percent of the residential portfolio is in GWIM
and represents residential mortgages that are originated for the home
purchase and refinancing needs of our affluent customers. The remaining
portion of the portfolio is mostly in All Other, and is comprised of both
purchased loans, including certain loans from the Countrywide portfolio,
as well as residential loans originated for our customers which are used
in our overall ALM activities.
Outstanding loans and leases decreased $27.0 billion at
December 31, 2008 compared to 2007 due to sales and conversions of
loans into retained mortgage backed securities totaling $56.8 billion as
well as paydowns partially offset by new loan originations and the addition
of the Countrywide portfolio. The Countrywide acquisition added $26.8
billion of residential mortgage outstandings, of which $9.9 billion are
included in the SOP 03-3 portfolio. Nonperforming balances increased
$5.0 billion due to the impacts of weak housing and economic conditions
and the addition of the non SOP 03-3 Countrywide portfolio due to sub-
sequent credit deterioration after acquisition. At December 31, 2008 and
2007, loans past due 90 days or more and still accruing interest of $372
million and $237 million were related to repurchases pursuant to our
servicing agreements with Government National Mortgage Association
(GNMA) mortgage pools where repayments are insured by the FHA or
guaranteed by the Department of Veterans Affairs.
Net charge-offs increased $869 million to $925 million for 2008, or
0.36 percent of total average residential mortgage loans compared to
0.02 percent for 2007. The increase was reflective of the impacts of the
weak housing markets and the slowing economy. See page 65 for more
information on the SOP 03-3 residential mortgage portfolio.
We mitigate a portion of our credit risk through synthetic securitiza-
tions which are cash collateralized and provide mezzanine risk protection
which will reimburse us in the event that losses exceed 10 bps of the
original pool balance. As of December 31, 2008 and 2007, $109.3 bil-
lion and $140.5 billion of mortgage loans were protected by these
agreements. As of December 31, 2008, $146 million of credit and other
related costs recognized in 2008 were reimbursable under these struc-
tures. In addition, we have entered into credit protection agreements with
GSEs on $9.6 billion and $32.9 billion as of December 31, 2008 and
2007, providing full protection on conforming residential mortgage loans
that become severely delinquent. Combined these structures provided
risk mitigation for approximately 48 percent and 63 percent of our resi-
dential mortgage portfolio at December 31, 2008 and 2007. The reduc-
tion in the protection was driven by an increase in loan sales and
securitizations during the period, some of which were insured, and the
percentage of protection was also impacted by the addition of Country-
wide mortgages resulting from the acquisition. Our regulatory risk-
weighted assets are reduced as a result of these risk protection
transactions because we transferred a portion of our credit risk to
unaffiliated parties. At December 31, 2008 and 2007, these transactions
had the cumulative effect of reducing our risk-weighted assets by
Bank of America 2008
63