Bank of America 2008 Annual Report Download - page 42
Download and view the complete annual report
Please find page 42 of the 2008 Bank of America annual report below. You can navigate through the pages in the report by either clicking on the pages listed below, or by using the keyword search tool below to find specific information within the annual report.-
 1
1 -
2
-
3
-
4
-
5
-
6
-
7
-
8
-
9
-
10
-
11
-
12
-
13
-
14
-
15
-
16
-
17
-
18
-
19
-
20
-
21
-
22
-
23
-
24
-
25
-
26
-
27
-
28
-
29
-
30
-
31
-
 32
32 -
 33
33 -
 34
34 -
 35
35 -
 36
36 -
 37
37 -
 38
38 -
 39
39 -
 40
40 -
 41
41 -
 42
42 -
 43
43 -
 44
44 -
 45
45 -
 46
46 -
 47
47 -
 48
48 -
 49
49 -
 50
50 -
 51
51 -
 52
52 -
53
-
54
-
55
-
56
-
57
-
58
-
59
-
60
-
61
-
62
-
63
-
64
-
65
-
66
-
67
-
68
-
69
-
70
-
71
-
72
-
73
-
74
-
75
-
76
-
77
-
78
-
79
-
80
-
81
-
82
-
83
-
84
-
85
-
86
-
87
-
88
-
89
-
90
-
91
-
92
-
93
-
94
-
95
-
96
-
97
-
98
-
99
-
100
-
101
-
102
-
103
-
104
-
105
-
106
-
107
-
108
-
109
-
110
-
111
-
112
-
113
-
114
-
115
-
116
-
117
-
118
-
119
-
120
-
121
-
122
-
123
-
124
-
125
-
126
-
127
-
128
-
129
-
130
-
131
-
132
-
133
-
134
-
135
-
136
-
137
-
138
-
139
-
140
-
141
-
142
-
143
-
144
-
145
-
146
-
147
-
148
-
149
-
150
-
151
-
152
-
153
-
154
-
155
-
156
-
157
-
158
-
159
-
160
-
161
-
162
-
163
-
164
-
165
-
166
-
167
-
168
-
169
-
170
-
171
-
172
-
173
-
174
-
175
-
176
-
177
-
178
-
179
-
180
-
181
-
182
-
183
-
184
-
185
-
186
-
187
-
188
-
189
-
190
-
191
-
192
-
193
-
194
-
195
 |
 |

very low prior year levels and higher net charge-offs and reserve increases
in the retail dealer-related loan portfolios due to deterioration and season-
ing of the portfolio reflective of growth.
Noninterest expense decreased $196 million, or nine percent, primar-
ily due to decreased incentive compensation partially offset by the
LaSalle merger.
Capital Markets and Advisory Services
CMAS provides financial products, advisory services and financing glob-
ally to our institutional investor clients in support of their investing and
trading activities. We also work with our commercial and corporate issuer
clients to provide debt and equity underwriting and distribution capa-
bilities, merger-related advisory services and risk management products
using interest rate, equity, credit, currency and commodity derivatives,
foreign exchange, fixed income and mortgage-related products. The busi-
ness may take positions in these products and participate in market-
making activities dealing in government securities, equity and equity-
linked securities, high-grade and high-yield corporate debt securities,
commercial paper, mortgage-backed securities and ABS. Underwriting
debt and equity, securities research and certain market-based activities
are executed through Banc of America Securities, LLC which is our pri-
mary dealer.
CMAS recognized a net loss of $4.9 billion in 2008 compared to a net
loss of $3.4 billion in 2007. Market-based revenue was a net loss of
$3.1 billion as compared to net revenue of $479 million. These
decreases were driven by losses related to CDO exposure and the
continuing impact of the market disruptions on various parts of our busi-
ness including the severe volatility, illiquidity and credit dislocations that
were experienced in the debt and equity markets in the fourth quarter of
2008. Partially offsetting these declines were favorable results in our liq-
uid products and equity underwriting businesses. In addition, noninterest
expense declined $1.2 billion primarily due to lower performance-based
incentive compensation. For more information relating to our market-
based revenue, see the discussion below.
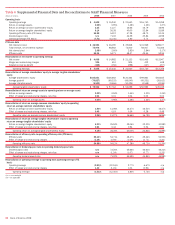
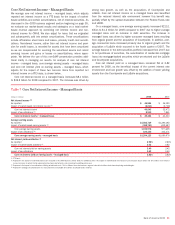
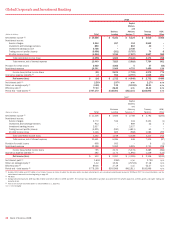
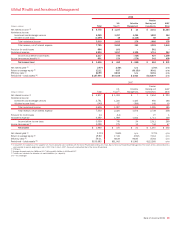
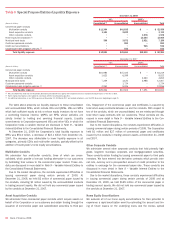
Market-based Revenue
CMAS evaluates its results using market-based revenue that is comprised
of net interest income and noninterest income. The following table pres-
ents further detail regarding market-based revenue. Sales and trading
revenue is segregated into fixed income from liquid products (primarily
interest rate and commodity derivatives and foreign exchange contracts),
credit products (primarily investment and noninvestment grade corporate
debt obligations, credit derivatives and public finance), structured prod-
ucts (primarily CMBS, residential mortgage-backed securities, structured
credit trading and CDOs), and equity income from equity-linked derivatives
and cash equity activity.
(Dollars in millions) 2008 2007
Investment banking income
Advisory fees
$ 287
$ 443
Debt underwriting
1,797
1,775
Equity underwriting
624
319
Total investment banking income
2,708
2,537
Sales and trading revenue
Fixed income:
Liquid products
3,608
2,155
Credit products
(2,273)
(212)
Structured products
(7,987)
(5,326)
Total fixed income
(6,652)
(3,383)
Equity income
813
1,325
Total sales and trading revenue
(5,839)
(2,058)
Total Capital Markets and Advisory Services
market-based revenue (1)
$(3,131)
$ 479
(1) Excludes $113 million and $70 million for 2008 and 2007 of net interest income on loans for which the
fair value option has been elected and is not considered market-based income.
Investment banking income increased $171 million to $2.7 billion as
compared to 2007 driven by increased equity underwriting fees partially
offset by lower advisory fees. Advisory fees were adversely impacted by
reduced activity due to the slowing economy. Equity underwriting income
was driven by fees earned on the Corporation’s stock issuances during
2008 for which CMAS was compensated on a management accounting
basis with a corresponding offset in All Other.
Sales and trading revenue declined $3.8 billion to a loss of $5.8 bil-
lion in 2008 compared to 2007. While structured products and credit
products reported losses for 2008, liquid products increased and equities
compared reasonably well with 2007 despite the continuing disruptive
market conditions.
ŠLiquid products sales and trading revenue increased $1.5 billion in
2008 compared to 2007 as CMAS took advantage of trending volatility
in interest rate and foreign exchange markets which also drove favor-
able client flows.
ŠCredit products sales and trading revenue declined $2.1 billion to a
loss of $2.3 billion in 2008 compared to 2007. During 2008, we
incurred losses of $1.1 billion, net of $286 million of fees, on lever-
aged loans and the forward leveraged finance commitments as investor
confidence faded and liquidity became largely non-existent. The few
institutions that were in a position to acquire additional loans, required
discount equivalent yields in excess of one-month LIBOR plus 1,000
bps in some instances, thus applying downward pressure to pricing
mechanisms, especially during the fourth quarter of 2008. Losses
incurred on our leveraged exposure were not concentrated in any one
type (senior secured or subordinated/senior unsecured) and were
generally due to wider new issuance credit spreads as compared to the
negotiated spreads. Credit products also incurred losses on ARS of
$898 million which included $312 million representing CMAS’s portion
of losses on the buyback from our customers. A significant portion of
these losses (i.e., $750 million) were concentrated in student loan
ARS. For further discussion on our ARS exposure, see Industry Concen-
trations beginning on page 76 and for a discussion on GWIM’s portion
of ARS losses on the buyback from our customers see page 45.
40
Bank of America 2008