Bank of America 2008 Annual Report Download - page 106
Download and view the complete annual report
Please find page 106 of the 2008 Bank of America annual report below. You can navigate through the pages in the report by either clicking on the pages listed below, or by using the keyword search tool below to find specific information within the annual report.-
 1
1 -
2
-
3
-
4
-
5
-
6
-
7
-
8
-
9
-
10
-
11
-
12
-
13
-
14
-
15
-
16
-
17
-
18
-
19
-
20
-
21
-
22
-
23
-
24
-
25
-
26
-
27
-
28
-
29
-
30
-
31
-
32
-
33
-
34
-
35
-
36
-
37
-
38
-
39
-
40
-
41
-
42
-
43
-
44
-
45
-
46
-
47
-
48
-
49
-
50
-
51
-
52
-
53
-
54
-
55
-
56
-
57
-
58
-
59
-
60
-
61
-
62
-
63
-
64
-
65
-
66
-
67
-
68
-
69
-
70
-
71
-
72
-
73
-
74
-
75
-
76
-
77
-
78
-
79
-
80
-
81
-
82
-
83
-
84
-
85
-
86
-
87
-
88
-
89
-
90
-
91
-
92
-
93
-
94
-
95
-
 96
96 -
 97
97 -
 98
98 -
 99
99 -
 100
100 -
 101
101 -
 102
102 -
 103
103 -
 104
104 -
 105
105 -
 106
106 -
 107
107 -
 108
108 -
 109
109 -
 110
110 -
 111
111 -
 112
112 -
 113
113 -
 114
114 -
 115
115 -
 116
116 -
117
-
118
-
119
-
120
-
121
-
122
-
123
-
124
-
125
-
126
-
127
-
128
-
129
-
130
-
131
-
132
-
133
-
134
-
135
-
136
-
137
-
138
-
139
-
140
-
141
-
142
-
143
-
144
-
145
-
146
-
147
-
148
-
149
-
150
-
151
-
152
-
153
-
154
-
155
-
156
-
157
-
158
-
159
-
160
-
161
-
162
-
163
-
164
-
165
-
166
-
167
-
168
-
169
-
170
-
171
-
172
-
173
-
174
-
175
-
176
-
177
-
178
-
179
-
180
-
181
-
182
-
183
-
184
-
185
-
186
-
187
-
188
-
189
-
190
-
191
-
192
-
193
-
194
-
195
 |
 |

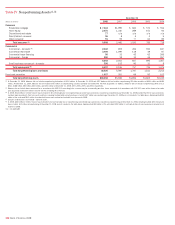
Table VI Allowance for Credit Losses
(Dollars in millions) 2008 2007 2006 2005 2004
Allowance for loan and lease losses, January 1
$ 11,588
$ 9,016 $ 8,045 $ 8,626 $ 6,163
Adjustment due to the adoption of SFAS 159 – (32) – – –
Loans and leases charged off
Residential mortgage
(964)
(78) (74) (58) (62)
Home equity
(3,597)
(286) (67) (46) (38)
Discontinued real estate
(19)
n/a n/a n/a n/a
Credit card – domestic
(4,469)
(3,410) (3,546) (4,018) (2,536)
Credit card – foreign
(639)
(453) (292) – –
Direct/Indirect consumer
(3,777)
(1,885) (857) (380) (344)
Other consumer
(461)
(346) (327) (376) (295)
Total consumer charge-offs
(13,926)
(6,458) (5,163) (4,878) (3,275)
Commercial – domestic
(1)
(2,567)
(1,135) (597) (535) (504)
Commercial real estate
(895)
(54) (7) (5) (12)
Commercial lease financing
(79)
(55) (28) (315) (39)
Commercial – foreign
(199)
(28) (86) (61) (262)
Total commercial charge-offs
(3,740)
(1,272) (718) (916) (817)
Total loans and leases charged off
(17,666)
(7,730) (5,881) (5,794) (4,092)
Recoveries of loans and leases previously charged off
Residential mortgage
39
22 35 31 26
Home equity
101
12 16 15 23
Discontinued real estate
3
n/a n/a n/a n/a
Credit card – domestic
308
347 452 366 231
Credit card – foreign
88
74 67 – –
Direct/Indirect consumer
663
512 247 132 136
Other consumer
62
68 110 101 102
Total consumer recoveries
1,264
1,035 927 645 518
Commercial – domestic
(2)
118
128 261 365 327
Commercial real estate
8
74515
Commercial lease financing
19
53 56 84 30
Commercial – foreign
26
27 94 133 89
Total commercial recoveries
171
215 415 587 461
Total recoveries of loans and leases previously charged off
1,435
1,250 1,342 1,232 979
Net charge-offs
(16,231)
(6,480) (4,539) (4,562) (3,113)
Provision for loan and lease losses
26,922
8,357 5,001 4,021 2,868
Other
(3)
792
727 509 (40) 2,708
Allowance for loan and lease losses, December 31
23,071
11,588 9,016 8,045 8,626
Reserve for unfunded lending commitments, January 1
518
397 395 402 416
Adjustment due to the adoption of SFAS 159 – (28) – – –
Provision for unfunded lending commitments
(97)
28 9 (7) (99)
Other
(4)
– 121 (7) – 85
Reserve for unfunded lending commitments, December 31
421
518 397 395 402
Allowance for credit losses, December 31
$ 23,492
$ 12,106 $ 9,413 $ 8,440 $ 9,028
Loans and leases outstanding at December 31
(5)
$926,033
$871,754 $706,490 $573,791 $521,813
Allowance for loan and lease losses as a percentage of total loans and leases
outstanding at December 31
(5, 6)
2.49%
1.33% 1.28% 1.40% 1.65%
Consumer allowance for loan and lease losses as a percentage of total consumer
loans and leases outstanding at December 31
(6)
2.83
1.23 1.19 1.27 1.34
Commercial allowance for loan and lease losses as a percentage of total
commercial loans and leases outstanding at December 31
(5)
1.90
1.51 1.44 1.62 2.19
Average loans and leases outstanding at December 31
(5, 6)
$905,944
$773,142 $652,417 $537,218 $472,617
Net charge-offs as a percentage of average loans and leases outstanding at
December 31
(5, 6)
1.79%
0.84% 0.70% 0.85% 0.66%
Allowance for loan and lease losses as a percentage of total nonperforming loans
and leases at December 31
(5, 6)
141
207 505 532 390
Ratio of the allowance for loan and lease losses at December 31 to
net charge-offs
(6)
1.42
1.79 1.99 1.76 2.77
(1) Includes small business commercial – domestic charge-offs of $2.0 billion, $931 million and $424 million in 2008, 2007 and 2006, respectively. Small business commercial – domestic charge offs were not material
in 2005 and 2004.
(2) Includes small business commercial – domestic recoveries of $39 million, $51 million and $54 million in 2008, 2007 and 2006, respectively. Small business commercial – domestic recoveries were not material in
2005 and 2004.
(3) The 2008 amount includes the $1.2 billion addition of the Countrywide allowance for loan losses as of July 1, 2008. The 2007 amount includes the $725 million and $25 million additions of the LaSalle and U.S. Trust
Corporation allowance for loan losses as of October 1, 2007 and July 1, 2007. The 2006 amount includes the $577 billion addition of the MBNA allowance for loan losses as of January 1, 2006. The 2004 amount
includes the $2.8 billion addition of the FleetBoston allowance for loan losses as of April 1, 2004.
(4) The 2007 amount includes the $124 million addition of the LaSalle reserve for unfunded lending commitments as of October 1, 2007. The 2004 amount includes the $85 million addition of the FleetBoston reserve for
unfunded lending commitments as of April 1, 2004.
(5) Outstanding loan and lease balances and ratios do not include loans measured at fair value in accordance with SFAS 159 at and for the year ended December 31, 2008 and 2007. Loans measured at fair value were
$5.4 billion and $4.6 billion at December 31, 2008 and 2007. Average loans measured at fair value were $4.9 billion and $3.0 billion for 2008 and 2007.
(6) We account for acquired impaired loans in accordance with SOP 03-3. For more information on the impact of SOP 03-3 on asset quality, see Consumer Portfolio Credit Risk Management beginning on page 62.
n/a = not applicable
104
Bank of America 2008