Bank of America 2008 Annual Report Download - page 26
Download and view the complete annual report
Please find page 26 of the 2008 Bank of America annual report below. You can navigate through the pages in the report by either clicking on the pages listed below, or by using the keyword search tool below to find specific information within the annual report.-
 1
1 -
2
-
3
-
4
-
5
-
6
-
7
-
8
-
9
-
10
-
11
-
12
-
13
-
14
-
15
-
 16
16 -
 17
17 -
 18
18 -
 19
19 -
 20
20 -
 21
21 -
 22
22 -
 23
23 -
 24
24 -
 25
25 -
 26
26 -
 27
27 -
 28
28 -
 29
29 -
 30
30 -
 31
31 -
 32
32 -
 33
33 -
 34
34 -
 35
35 -
 36
36 -
37
-
38
-
39
-
40
-
41
-
42
-
43
-
44
-
45
-
46
-
47
-
48
-
49
-
50
-
51
-
52
-
53
-
54
-
55
-
56
-
57
-
58
-
59
-
60
-
61
-
62
-
63
-
64
-
65
-
66
-
67
-
68
-
69
-
70
-
71
-
72
-
73
-
74
-
75
-
76
-
77
-
78
-
79
-
80
-
81
-
82
-
83
-
84
-
85
-
86
-
87
-
88
-
89
-
90
-
91
-
92
-
93
-
94
-
95
-
96
-
97
-
98
-
99
-
100
-
101
-
102
-
103
-
104
-
105
-
106
-
107
-
108
-
109
-
110
-
111
-
112
-
113
-
114
-
115
-
116
-
117
-
118
-
119
-
120
-
121
-
122
-
123
-
124
-
125
-
126
-
127
-
128
-
129
-
130
-
131
-
132
-
133
-
134
-
135
-
136
-
137
-
138
-
139
-
140
-
141
-
142
-
143
-
144
-
145
-
146
-
147
-
148
-
149
-
150
-
151
-
152
-
153
-
154
-
155
-
156
-
157
-
158
-
159
-
160
-
161
-
162
-
163
-
164
-
165
-
166
-
167
-
168
-
169
-
170
-
171
-
172
-
173
-
174
-
175
-
176
-
177
-
178
-
179
-
180
-
181
-
182
-
183
-
184
-
185
-
186
-
187
-
188
-
189
-
190
-
191
-
192
-
193
-
194
-
195
 |
 |

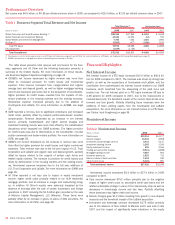
Performance Overview
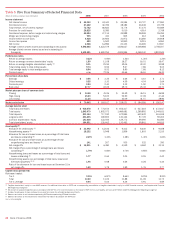
Net income was $4.0 billion, or $0.55 per diluted common share in 2008, as compared to $15.0 billion, or $3.30 per diluted common share in 2007.
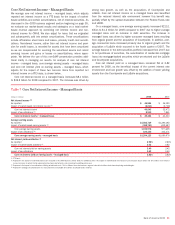
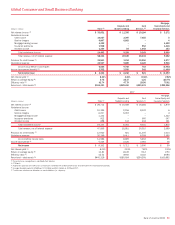
Table 1 Business Segment Total Revenue and Net Income
Total Revenue
(1)
Net Income (Loss)
(Dollars in millions) 2008 2007 2008 2007
Global Consumer and Small Business Banking
(2)
$58,344
$47,855 $ 4,234 $ 9,362
Global Corporate and Investment Banking
13,440
13,651 (14) 510
Global Wealth and Investment Management
7,785
7,553 1,416 1,960
All Other
(2)
(5,593)
(477) (1,628) 3,150
Total FTE basis
73,976
68,582 4,008 14,982
FTE adjustment
(1,194)
(1,749) ––
Total Consolidated
$72,782
$66,833 $ 4,008 $14,982
(1) Total revenue is net of interest expense, and is on a FTE basis for the business segments and All Other. For more information on a FTE basis, see Supplemental Financial Data beginning on page 29.
(2) GCSBB is presented on a managed basis with a corresponding offset recorded in All Other.
The table above presents total revenue and net income for the busi-
ness segments and All Other and the following discussion presents a
summary of the related results. For more information on these results,
see Business Segment Operations beginning on page 32.
ŠGCSBB’s net income decreased as higher revenue was more than
offset by increased provision for credit losses and noninterest
expense. Total revenue increased from merger-related and organic
average loan and deposit growth, as well as higher mortgage banking
income and insurance premiums due to the acquisition of Countrywide.
Higher provision for credit losses resulted from the impacts of con-
tinued weakness in the housing markets and the slowing economy.
Noninterest expense increased primarily due to the addition of
Countrywide and LaSalle. For more information on GCSBB, see page
33.
ŠGCIB reported a net loss due to significant writedowns and increased
credit costs, partially offset by reduced performance-based incentive
compensation. Revenue decreased as an increase in net interest
income, primarily market-based, and higher service charges and
investment banking income were more than offset by the market-based
disruptions which impacted our CMAS business. The higher provision
for credit losses was due to deterioration in the homebuilder, non-real
estate commercial and dealer-related portfolio. For more information on
GCIB, see page 38.
ŠGWIM’s net income decreased as the increase in revenue was more
than offset by higher provision for credit losses and higher noninterest
expenses. Total revenue rose due to the full year impact of U.S. Trust
Corporation and LaSalle and organic loan and deposit growth, partially
offset by losses related to the support of certain cash funds and
weaker equity markets. The increase in provision for credit losses was
driven by deterioration in the housing markets and the slowing econo-
my. Noninterest expense increased due to the full year additions of
U.S. Trust Corporation and LaSalle. For more information on GWIM, see
page 45.
ŠAll Other reported a net loss due to losses in equity investment
income, higher credit costs primarily related to our ALM residential
mortgage portfolio, and an increase in merger and restructuring charg-
es. In addition All Other’s results were adversely impacted by the
absence of earnings after the sale of certain businesses and foreign
operations in 2007 including the $1.5 billion gain recorded on the sale
of Marsico Capital Management, LLC (Marsico). These items were
partially offset by an increase in gains on sales of debt securities. For
more information on All Other, see page 48.
Financial Highlights
Net Interest Income
Net interest income on a FTE basis increased $10.4 billion to $46.6 bil-
lion for 2008 compared to 2007. The increase was driven by strong loan
growth, as well as the acquisitions of Countrywide and LaSalle, and the
contribution from market-based net interest income related to our CMAS
business, which benefited from the steepening of the yield curve and
product mix. The net interest yield on a FTE basis increased 38 bps to
2.98 percent for 2008 compared to 2007, due to the improvement in
market-based yield, the beneficial impact of the current interest rate envi-
ronment and loan growth. Partially offsetting these increases were the
additions of lower yielding assets from the Countrywide and LaSalle
acquisitions. For more information on net interest income on a FTE basis,
see Tables I and II beginning on page 99.
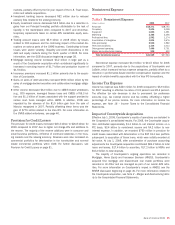
Noninterest Income
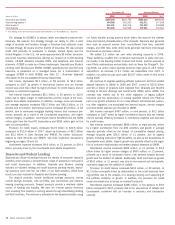
Table 2 Noninterest Income
(Dollars in millions) 2008 2007
Card income
$13,314
$14,077
Service charges
10,316
8,908
Investment and brokerage services
4,972
5,147
Investment banking income
2,263
2,345
Equity investment income
539
4,064
Trading account profits (losses)
(5,911)
(4,889)
Mortgage banking income
4,087
902
Insurance premiums
1,833
761
Gains on sales of debt securities
1,124
180
Other income (loss)
(5,115)
897
Total noninterest income
$27,422
$32,392
Noninterest income decreased $5.0 billion to $27.4 billion in 2008
compared to 2007.
ŠCard income decreased $763 million primarily due to the negative
impact of higher credit costs on securitized credit card loans and the
related unfavorable change in value of the interest-only strip as well as
decreases in interchange income and late fees. Partially offsetting
these decreases was higher debit card income.
ŠService charges grew $1.4 billion resulting from growth in new deposit
accounts and the beneficial impact of the LaSalle acquisition.
ŠInvestment and brokerage services decreased $175 million primarily
due to the absence of fees related to Marsico which was sold in late
2007 and the impact of significantly lower valuations in the equity
24
Bank of America 2008