Bank of America 2008 Annual Report Download - page 51
Download and view the complete annual report
Please find page 51 of the 2008 Bank of America annual report below. You can navigate through the pages in the report by either clicking on the pages listed below, or by using the keyword search tool below to find specific information within the annual report.-
 1
1 -
2
-
3
-
4
-
5
-
6
-
7
-
8
-
9
-
10
-
11
-
12
-
13
-
14
-
15
-
16
-
17
-
18
-
19
-
20
-
21
-
22
-
23
-
24
-
25
-
26
-
27
-
28
-
29
-
30
-
31
-
32
-
33
-
34
-
35
-
36
-
37
-
38
-
39
-
40
-
 41
41 -
 42
42 -
 43
43 -
 44
44 -
 45
45 -
 46
46 -
 47
47 -
 48
48 -
 49
49 -
 50
50 -
 51
51 -
 52
52 -
 53
53 -
 54
54 -
 55
55 -
 56
56 -
 57
57 -
 58
58 -
 59
59 -
 60
60 -
 61
61 -
62
-
63
-
64
-
65
-
66
-
67
-
68
-
69
-
70
-
71
-
72
-
73
-
74
-
75
-
76
-
77
-
78
-
79
-
80
-
81
-
82
-
83
-
84
-
85
-
86
-
87
-
88
-
89
-
90
-
91
-
92
-
93
-
94
-
95
-
96
-
97
-
98
-
99
-
100
-
101
-
102
-
103
-
104
-
105
-
106
-
107
-
108
-
109
-
110
-
111
-
112
-
113
-
114
-
115
-
116
-
117
-
118
-
119
-
120
-
121
-
122
-
123
-
124
-
125
-
126
-
127
-
128
-
129
-
130
-
131
-
132
-
133
-
134
-
135
-
136
-
137
-
138
-
139
-
140
-
141
-
142
-
143
-
144
-
145
-
146
-
147
-
148
-
149
-
150
-
151
-
152
-
153
-
154
-
155
-
156
-
157
-
158
-
159
-
160
-
161
-
162
-
163
-
164
-
165
-
166
-
167
-
168
-
169
-
170
-
171
-
172
-
173
-
174
-
175
-
176
-
177
-
178
-
179
-
180
-
181
-
182
-
183
-
184
-
185
-
186
-
187
-
188
-
189
-
190
-
191
-
192
-
193
-
194
-
195
 |
 |

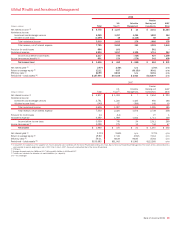
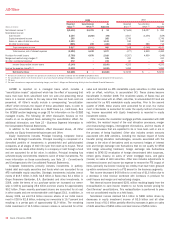
The following table presents the components of All Other’s equity
investment income and a reconciliation to the total consolidated equity
investment income for 2008 and 2007.
Components of Equity Investment Income
(Dollars in millions) 2008 2007
Principal Investing
$ (84)
$2,217
Corporate Investments
(520)
445
Strategic and other investments
869
1,083
Total equity investment income included in All Other
265
3,745
Total equity investment income included in the business
segments
274
319
Total consolidated equity investment income
$ 539
$4,064
Equity investment income decreased $3.5 billion primarily due to
losses from our Principal Investing portfolio attributable to the lack of liq-
uidity in the marketplace. In addition, we incurred other-than-temporary
impairment losses on AFS marketable equity securities of $661 million
which included writedowns on Fannie Mae and Freddie Mac preferred
securities and a number of other equity securities where we did not
believe that the declines in value would be recoverable.
All other income (loss) decreased due to the absence of the $1.5 bil-
lion gain on the sale of our Marsico business during 2007 partially offset
by losses in 2007 of $394 million on securities after they were pur-
chased at fair value from certain cash funds managed within GWIM.In
2008, losses on securities purchased from cash funds were recorded
within GWIM. In addition, All Other’s results were adversely impacted by
the absence of earnings due to the sale of certain businesses and for-
eign operations in 2007. These decreases were partially offset by
increases in card income driven by the funds transfer pricing allocations
discussed in net interest income. Further, losses were partially offset by
increases in gains on sales of mortgage-backed securities and collateral-
ized mortgage obligations.
Provision for credit losses increased $3.2 billion to $2.9 billion primar-
ily due to higher credit costs related to our ALM residential mortgage port-
folio reflective of deterioration in the housing markets and the impacts of
a slowing economy. Additionally, deterioration in our Countrywide dis-
continued real estate portfolio subsequent to the July 1, 2008 acquisition
as well as the absence of 2007 reserve reductions also contributed to
the increase in provision.
Merger and restructuring charges increased $525 million to $935 mil-
lion due to the integration costs associated with the Countrywide and
LaSalle acquisitions. For additional information on merger and restructur-
ing charges, see Note 2 – Merger and Restructuring Activity to the Con-
solidated Financial Statements.
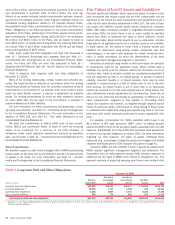
Off- and On-Balance Sheet Arrangements
In the ordinary course of business, we support our customers’ financing
needs by facilitating their access to the commercial paper market. In
addition, we utilize certain financing arrangements to meet our balance
sheet management, funding and liquidity needs. For additional
information on our liquidity risk, see Liquidity Risk and Capital Manage-
ment beginning on page 55. These activities utilize SPEs, typically in the
form of corporations, limited liability companies, or trusts, which raise
funds by issuing short-term commercial paper or similar instruments to
third party investors. These SPEs typically hold various types of financial
assets whose cash flows are the primary source of repayment for the
liabilities of the SPEs. Investors have recourse to the assets in the SPE
and often benefit from other credit enhancements, such as over-
collateralization in the form of excess assets in the SPE, liquidity facili-
ties, and other arrangements. As a result, the SPEs can typically obtain a
favorable credit rating from the rating agencies, resulting in lower financ-
ing costs for our customers.
We have liquidity agreements, SBLCs or other arrangements with the
SPEs, as described below, under which we are obligated to provide fund-
ing in the event of a market disruption or other specified event or other-
wise provide credit support to the entities (hereinafter referred to as
liquidity exposure). We manage our credit risk and any market risk on
these arrangements by subjecting them to our normal underwriting and
risk management processes. Our credit ratings and changes thereto will
affect the borrowing cost and liquidity of these SPEs. In addition, sig-
nificant changes in counterparty asset valuation and credit standing may
also affect the ability of the SPEs to issue commercial paper. The con-
tractual or notional amount of these commitments as presented in Table
8, represents our maximum possible funding obligation and is not, in
management’s view, representative of expected losses or funding
requirements.
Bank of America 2008
49