Bank of America 2008 Annual Report Download - page 71
Download and view the complete annual report
Please find page 71 of the 2008 Bank of America annual report below. You can navigate through the pages in the report by either clicking on the pages listed below, or by using the keyword search tool below to find specific information within the annual report.-
 1
1 -
2
-
3
-
4
-
5
-
6
-
7
-
8
-
9
-
10
-
11
-
12
-
13
-
14
-
15
-
16
-
17
-
18
-
19
-
20
-
21
-
22
-
23
-
24
-
25
-
26
-
27
-
28
-
29
-
30
-
31
-
32
-
33
-
34
-
35
-
36
-
37
-
38
-
39
-
40
-
41
-
42
-
43
-
44
-
45
-
46
-
47
-
48
-
49
-
50
-
51
-
52
-
53
-
54
-
55
-
56
-
57
-
58
-
59
-
60
-
 61
61 -
 62
62 -
 63
63 -
 64
64 -
 65
65 -
 66
66 -
 67
67 -
 68
68 -
 69
69 -
 70
70 -
 71
71 -
 72
72 -
 73
73 -
 74
74 -
 75
75 -
 76
76 -
 77
77 -
 78
78 -
 79
79 -
 80
80 -
 81
81 -
82
-
83
-
84
-
85
-
86
-
87
-
88
-
89
-
90
-
91
-
92
-
93
-
94
-
95
-
96
-
97
-
98
-
99
-
100
-
101
-
102
-
103
-
104
-
105
-
106
-
107
-
108
-
109
-
110
-
111
-
112
-
113
-
114
-
115
-
116
-
117
-
118
-
119
-
120
-
121
-
122
-
123
-
124
-
125
-
126
-
127
-
128
-
129
-
130
-
131
-
132
-
133
-
134
-
135
-
136
-
137
-
138
-
139
-
140
-
141
-
142
-
143
-
144
-
145
-
146
-
147
-
148
-
149
-
150
-
151
-
152
-
153
-
154
-
155
-
156
-
157
-
158
-
159
-
160
-
161
-
162
-
163
-
164
-
165
-
166
-
167
-
168
-
169
-
170
-
171
-
172
-
173
-
174
-
175
-
176
-
177
-
178
-
179
-
180
-
181
-
182
-
183
-
184
-
185
-
186
-
187
-
188
-
189
-
190
-
191
-
192
-
193
-
194
-
195
 |
 |

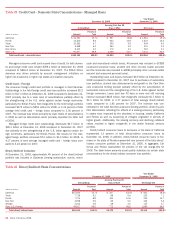
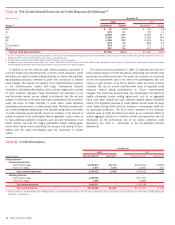
Other Consumer
At December 31, 2008, approximately 76 percent of the other consumer
portfolio was associated with portfolios from certain consumer finance
businesses that we have previously exited and is included in All Other.
The remainder consisted of the foreign consumer loan portfolio which is
mostly included in Card Services and deposit overdrafts. Net charge-offs
increased $121 million for 2008 from 2007 driven by deposit overdraft
net charge-offs reflecting higher average balances per account and
account growth.
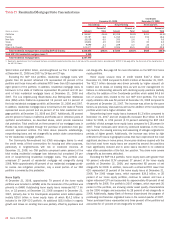
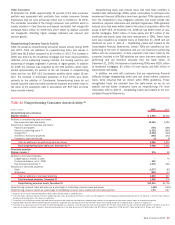
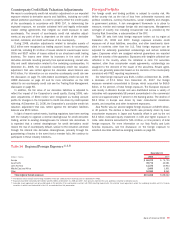
Nonperforming Consumer Assets Activity
Table 24 presents nonperforming consumer assets activity during 2008
and 2007. Total net additions to nonperforming loans and leases in
2008 were $6.5 billion compared to $2.4 billion in 2007. The increase in
2008 was driven by the residential mortgage and home equity portfolios
reflective of the weakening housing markets, the slowing economy and
seasoning of vintages originated in periods of higher growth. In addition
for 2008 the increase was impacted by the CRA portfolio, which repre-
sented approximately 19 percent of the net increase in nonperforming
loans and the non SOP 03-3 Countrywide portfolio which added 15 per-
cent. The increase in foreclosed properties of $1.2 billion was driven
primarily by the addition of Countrywide. Nonperforming loans do not
include acquired loans that were considered impaired and written down to
fair value at the acquisition date in accordance with SOP 03-3 as these
loans accrete interest.
Nonperforming loans also include loans that have been modified in
troubled debt restructurings (TDRs) where concessions to borrowers who
experienced financial difficulties have been granted. TDRs typically result
from the Corporation’s loss mitigation activities and could include rate
reductions, payment extensions and principal forgiveness. TDRs generally
exclude loans that were written down to fair value at acquisition within the
scope of SOP 03-3. At December 31, 2008 we had $529 million of resi-
dential mortgages, $303 million of home equity and $71 million of dis-
continued real estate loans that were restructured in TDRs. These loans
were also classified as impaired loans at December 31, 2008 and are
disclosed as such in Note 6 – Outstanding Loans and Leases to the
Consolidated Financial Statements. Certain TDRs are classified as non-
performing at the time of restructure and are not returned to performing
status until six consecutive, on-time payments have been made by the
customer. Included in the TDR balances are loans that were classified as
performing and are therefore excluded from the table below. At
December 31, 2008, the balances of performing TDRs were $320 million
of residential mortgages, $1 million of home equity, and $66 million of
discontinued real estate.
In addition, we work with customers that are experiencing financial
difficulty through renegotiating credit card and direct/indirect consumer
loans, while ensuring that we remain within FFIEC guidelines. These
renegotiated loans are excluded from the table below as we do not
classify non-real estate unsecured loans as nonperforming. For more
information refer to Note 6 – Outstanding Loans and Leases to the Con-
solidated Financial Statements.
Table 24 Nonperforming Consumer Assets Activity (1)
(Dollars in millions) 2008 2007
Nonperforming loans and leases
Balance, January 1
$ 3,442
$1,030
Additions to nonperforming loans and leases:
New nonaccrual loans and leases
13,625
4,093
Reductions in nonperforming loans and leases:
Paydowns and payoffs
(704)
(366)
Returns to performing status
(2)
(1,522)
(855)
Charge-offs
(3)
(4,032)
(300)
Transfers to foreclosed properties
(895)
(152)
Transfers to loans held-for-sale
(6)
(8)
Total net additions to nonperforming loans and leases
6,466
2,412
Total nonperforming loans and leases, December 31 (4)
9,908
3,442
Foreclosed properties
Balance, January 1
276
59
Additions to foreclosed properties:
LaSalle balance, October 1, 2007
–
70
Countrywide balance, July 1, 2008
952
–
New foreclosed properties
(5)
1,578
246
Reductions in foreclosed properties:
Sales
(1,077)
(82)
Writedowns
(223)
(17)
Total net additions to foreclosed properties
1,230
217
Total foreclosed properties, December 31
1,506
276
Nonperforming consumer assets, December 31
$11,414
$3,718
Nonperforming consumer loans and leases as a percentage of outstanding consumer loans and leases
1.68%
0.62%
Nonperforming consumer assets as a percentage of outstanding consumer loans, leases and foreclosed properties
1.93
0.67
(1) Balances do not include nonperforming LHFS of $436 million and $95 million in 2008 and 2007.
(2) Consumer loans and leases may be restored to performing status when all principal and interest is current and full repayment of the remaining contractual principal and interest is expected, or when the loan otherwise
becomes well-secured and is in the process of collection.
(3) Our policy is not to classify consumer credit card and consumer non-real estate loans and leases as nonperforming; therefore, the charge-offs on these loans have no impact on nonperforming activity.
(4) Approximately half of the 2008 nonperforming loans and leases are greater than 180 days past due and have been written down through charge-offs to approximately 71 percent of original cost.
(5) Our policy is to record any losses in the value of foreclosed properties as a reduction in the allowance for credit losses during the first 90 days after transfer of a loan into foreclosed properties. Thereafter, all losses in
value are recorded as noninterest expense. New foreclosed properties in the table above are net of $436 million and $75 million of charge-offs in 2008 and 2007 taken during the first 90 days after transfer.
Bank of America 2008
69