Bank of America 2008 Annual Report Download - page 40
Download and view the complete annual report
Please find page 40 of the 2008 Bank of America annual report below. You can navigate through the pages in the report by either clicking on the pages listed below, or by using the keyword search tool below to find specific information within the annual report.-
 1
1 -
2
-
3
-
4
-
5
-
6
-
7
-
8
-
9
-
10
-
11
-
12
-
13
-
14
-
15
-
16
-
17
-
18
-
19
-
20
-
21
-
22
-
23
-
24
-
25
-
26
-
27
-
28
-
29
-
 30
30 -
 31
31 -
 32
32 -
 33
33 -
 34
34 -
 35
35 -
 36
36 -
 37
37 -
 38
38 -
 39
39 -
 40
40 -
 41
41 -
 42
42 -
 43
43 -
 44
44 -
 45
45 -
 46
46 -
 47
47 -
 48
48 -
 49
49 -
 50
50 -
51
-
52
-
53
-
54
-
55
-
56
-
57
-
58
-
59
-
60
-
61
-
62
-
63
-
64
-
65
-
66
-
67
-
68
-
69
-
70
-
71
-
72
-
73
-
74
-
75
-
76
-
77
-
78
-
79
-
80
-
81
-
82
-
83
-
84
-
85
-
86
-
87
-
88
-
89
-
90
-
91
-
92
-
93
-
94
-
95
-
96
-
97
-
98
-
99
-
100
-
101
-
102
-
103
-
104
-
105
-
106
-
107
-
108
-
109
-
110
-
111
-
112
-
113
-
114
-
115
-
116
-
117
-
118
-
119
-
120
-
121
-
122
-
123
-
124
-
125
-
126
-
127
-
128
-
129
-
130
-
131
-
132
-
133
-
134
-
135
-
136
-
137
-
138
-
139
-
140
-
141
-
142
-
143
-
144
-
145
-
146
-
147
-
148
-
149
-
150
-
151
-
152
-
153
-
154
-
155
-
156
-
157
-
158
-
159
-
160
-
161
-
162
-
163
-
164
-
165
-
166
-
167
-
168
-
169
-
170
-
171
-
172
-
173
-
174
-
175
-
176
-
177
-
178
-
179
-
180
-
181
-
182
-
183
-
184
-
185
-
186
-
187
-
188
-
189
-
190
-
191
-
192
-
193
-
194
-
195
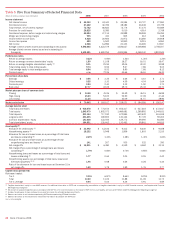
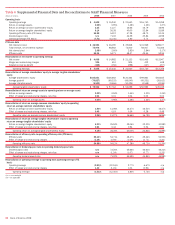
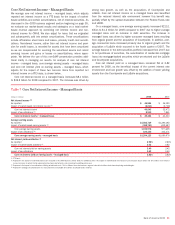
 |
 |

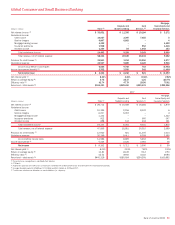
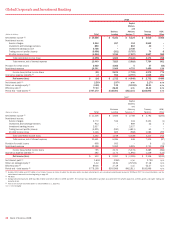
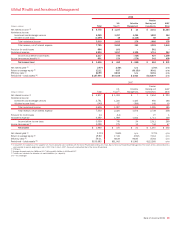
Global Corporate and Investment Banking
2008
(Dollars in millions) Total
Business
Lending
Capital
Markets
and
Advisory
Services
(1)
Treasury
Services
ALM/
Other
Net interest income
(2)
$ 16,538 $ 6,221 $ 6,124 $ 3,610 $ 583
Noninterest income:
Service charges
3,344 657 134 2,553 –
Investment and brokerage services
850 – 810 40 –
Investment banking income
2,708 – 2,708 – –
Trading account profits (losses)
(5,956) (251) (5,787) 74 8
All other income (loss)
(4,044) 1,196 (7,007) 1,507 260
Total noninterest income (loss)
(3,098) 1,602 (9,142) 4,174 268
Total revenue, net of interest expense
13,440 7,823 (3,018) 7,784 851
Provision for credit losses
3,080 3,082 5 47 (54)
Noninterest expense
10,381 2,066 4,722 3,459 134
Income (loss) before income taxes
(21) 2,675 (7,745) 4,278 771
Income tax expense (benefit)
(2)
(7) 953 (2,797) 1,546 291
Net income (loss)
$ (14) $ 1,722 $ (4,948) $ 2,732 $ 480
Net interest yield
(2)
2.36% 1.97% n/m 2.17% n/m
Return on average equity
(3)
(0.02) 7.38 (24.32)% 33.21 n/m
Efficiency ratio
(2)
77.24 26.40 n/m 44.43 n/m
Period end – total assets
(4)
$707,170 $336,561 $313,141 $223,895 n/m
2007
(Dollars in millions) Total
Business
Lending
Capital
Markets
and
Advisory
Services
(1)
Treasury
Services
ALM/
Other
Net interest income
(2)
$ 11,206 $ 4,926 $ 2,788 $ 3,792 $(300)
Noninterest income:
Service charges 2,770 516 134 2,121 (1)
Investment and brokerage services 913 – 869 42 2
Investment banking income 2,537 – 2,537 – –
Trading account profits (losses) (4,921) (180) (4,811) 63 7
All other income (loss) 1,146 823 (968) 1,086 205
Total noninterest income (loss) 2,445 1,159 (2,239) 3,312 213
Total revenue, net of interest expense 13,651 6,085 549 7,104 (87)
Provision for credit losses 658 653 – 6 (1)
Noninterest expense 12,198 2,262 5,925 3,713 298
Income (loss) before income taxes 795 3,170 (5,376) 3,385 (384)
Income tax expense (benefit)
(2)
285 1,170 (1,991) 1,249 (143)
Net income (loss) $ 510 $ 2,000 $ (3,385) $ 2,136 $(241)
Net interest yield
(2)
1.65% 1.96% n/m 2.79% n/m
Return on average equity
(3)
1.12 12.36 (25.52)% 27.18 n/m
Efficiency ratio
(2)
89.36 37.19 n/m 52.27 n/m
Period end – total assets
(4)
$778,158 $303,966 $413,811 $183,996 n/m
(1) Includes $113 million and $70 million of net interest income on loans for which the fair value option has been elected and is not considered market-based income for 2008 and 2007. For more information, see the
market-based revenue discussion beginning on page 40.
(2) FTE basis
(3) Average allocated equity for GCIB was $62.4 billion and $45.3 billion for 2008 and 2007. The increase was attributable to goodwill associated with the LaSalle acquisition, portfolio growth, and higher trading and
operational risk.
(4) Total assets include asset allocations to match liabilities (i.e., deposits).
n/m = not meaningful
38
Bank of America 2008