Bank of America 2008 Annual Report Download - page 82
Download and view the complete annual report
Please find page 82 of the 2008 Bank of America annual report below. You can navigate through the pages in the report by either clicking on the pages listed below, or by using the keyword search tool below to find specific information within the annual report.-
 1
1 -
2
-
3
-
4
-
5
-
6
-
7
-
8
-
9
-
10
-
11
-
12
-
13
-
14
-
15
-
16
-
17
-
18
-
19
-
20
-
21
-
22
-
23
-
24
-
25
-
26
-
27
-
28
-
29
-
30
-
31
-
32
-
33
-
34
-
35
-
36
-
37
-
38
-
39
-
40
-
41
-
42
-
43
-
44
-
45
-
46
-
47
-
48
-
49
-
50
-
51
-
52
-
53
-
54
-
55
-
56
-
57
-
58
-
59
-
60
-
61
-
62
-
63
-
64
-
65
-
66
-
67
-
68
-
69
-
70
-
71
-
 72
72 -
 73
73 -
 74
74 -
 75
75 -
 76
76 -
 77
77 -
 78
78 -
 79
79 -
 80
80 -
 81
81 -
 82
82 -
 83
83 -
 84
84 -
 85
85 -
 86
86 -
 87
87 -
 88
88 -
 89
89 -
 90
90 -
 91
91 -
 92
92 -
93
-
94
-
95
-
96
-
97
-
98
-
99
-
100
-
101
-
102
-
103
-
104
-
105
-
106
-
107
-
108
-
109
-
110
-
111
-
112
-
113
-
114
-
115
-
116
-
117
-
118
-
119
-
120
-
121
-
122
-
123
-
124
-
125
-
126
-
127
-
128
-
129
-
130
-
131
-
132
-
133
-
134
-
135
-
136
-
137
-
138
-
139
-
140
-
141
-
142
-
143
-
144
-
145
-
146
-
147
-
148
-
149
-
150
-
151
-
152
-
153
-
154
-
155
-
156
-
157
-
158
-
159
-
160
-
161
-
162
-
163
-
164
-
165
-
166
-
167
-
168
-
169
-
170
-
171
-
172
-
173
-
174
-
175
-
176
-
177
-
178
-
179
-
180
-
181
-
182
-
183
-
184
-
185
-
186
-
187
-
188
-
189
-
190
-
191
-
192
-
193
-
194
-
195
 |
 |

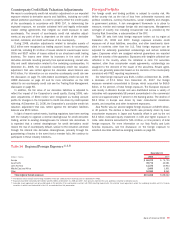
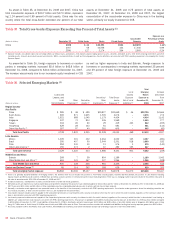
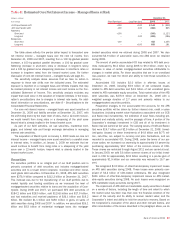
As shown in Table 35, at December 31, 2008 and 2007, China had
total cross-border exposure of $20.7 billion and $17.0 billion, represent-
ing 1.14 percent and 0.99 percent of total assets. China was the only
country where the total cross-border exceeded one percent of our total
assets at December 31, 2008 and 0.75 percent of total assets at
December 31, 2007. At December 31, 2008 and 2007, the largest
concentration of the cross-border exposure to China was in the banking
sector, primarily our equity investment in CCB.
Table 35 Total Cross-border Exposure Exceeding One Percent of Total Assets (1)
(Dollars in millions) December 31 Public Sector Banks Private Sector
Cross-border
Exposure
Exposure as a
Percentage of Total
Assets
China
2008
$ 44 $ 20,091 $524 $ 20,659 1.14%
2007 58 16,558 424 17,040 0.99
2006
127 3,174 264 3,565 0.24
(1) Exposure includes cross-border claims by our foreign offices as follows: loans, acceptances, time deposits placed, trading account assets, securities, derivative assets, other interest-earning investments and other
monetary assets. Amounts also include unused commitments, SBLCs, commercial letters of credit and formal guarantees. Sector definitions are consistent with FFIEC reporting requirements for preparing the Country
Exposure Report.
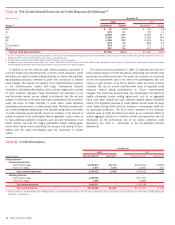
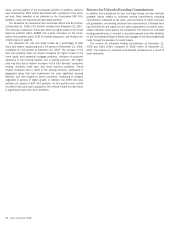
As presented in Table 36, foreign exposure to borrowers or counter-
parties in emerging markets increased $5.4 billion to $45.8 billion at
December 31, 2008, compared to $40.4 billion at December 31, 2007.
The increase was primarily due to our increased equity investment in CCB
as well as higher exposures in India and Bahrain. Foreign exposure to
borrowers or counterparties in emerging markets represented 35 percent
and 29 percent of total foreign exposure at December 31, 2008 and
2007.
Table 36 Selected Emerging Markets (1)
(Dollars in millions)
Loans and
Leases, and
Loan
Commitments
Other
Financing
(2)
Derivative
Assets
(3)
Securities/
Other
Investments
(4)
Total Cross-
border
Exposure
(5)
Local
Country
Exposure
Net of Local
Liabilities
(6)
Total
Emerging
Market
Exposure at
December 31,
2008
Increase
(Decrease)
From
December 31,
2007
Region/Country
Asia Pacific
China
$ 285
$ 48 $ 499 $19,827 $20,659 $ 46 $20,705 $3,665
South Korea
665
871 1,635 1,505 4,676 – 4,676 274
India
1,521
689 1,045 1,179 4,434 – 4,434 1,142
Singapore
347
73 813 336 1,569 – 1,569 277
Taiwan
304
26 60 29 419 423 842 (225)
Hong Kong
429
28 143 81 681 – 681 (114)
Other Asia Pacific
(7)
187
97 40 281 605 – 605 (82)
Total Asia Pacific
3,738
1,832 4,235 23,238 33,043 469 33,512 4,937
Latin America
Mexico
1,335
301 132 2,264 4,032 125 4,157 (281)
Brazil
350
407 50 2,544 3,351 518 3,869 182
Chile
294
241 30 11 576 3 579 (140)
Other Latin America
(7)
150
273 2 67 492 155 647 –
Total Latin America
2,129
1,222 214 4,886 8,451 801 9,252 (239)
Middle East and Africa
Bahrain
269
7 59 854 1,189 – 1,189 1,042
Other Middle East and Africa
(7)
661
131 367 107 1,266 – 1,266 (528)
Total Middle East and Africa
930
138 426 961 2,455 – 2,455 514
Central and Eastern Europe (7)
65
114 262 188 629 – 629 205
Total emerging market exposure
$6,862
$3,306 $5,137 $29,273 $44,578 $1,270 $45,848 $5,417
(1) There is no generally accepted definition of emerging markets. The definition that we use includes all countries in Asia Pacific excluding Japan, Australia and New Zealand; all countries in Latin America excluding
Cayman Islands and Bermuda; all countries in Middle East and Africa; and all countries in Central and Eastern Europe excluding Greece. There was no emerging market exposure included in the portfolio measured at
fair value in accordance with SFAS 159 at December 31, 2008 and 2007.
(2) Includes acceptances, standby letters of credit, commercial letters of credit and formal guarantees.
(3) Derivative assets are reported on a mark-to-market basis and have been reduced by the amount of cash collateral applied of $152 million and $57 million at December 31, 2008 and 2007. At December 31, 2008 and
2007 there were $531 million and $2 million of other marketable securities collateralizing derivative assets for which credit risk has not been reduced.
(4) Generally, cross-border resale agreements are presented based on the domicile of the counterparty, consistent with FFIEC reporting requirements. Cross-border resale agreements where the underlying securities are
U.S. Treasury securities, in which case the domicile is the U.S., are excluded from this presentation.
(5) Cross-border exposure includes amounts payable to the Corporation by borrowers or counterparties with a country of residence other than the one in which the credit is booked, regardless of the currency in which the
claim is denominated, consistent with FFIEC reporting requirements.
(6) Local country exposure includes amounts payable to the Corporation by borrowers with a country of residence in which the credit is booked, regardless of the currency in which the claim is denominated. Local funding or
liabilities are subtracted from local exposures consistent with FFIEC reporting requirements. Total amount of available local liabilities funding local country exposure at December 31, 2008 was $12.6 billion compared
to $21.6 billion at December 31, 2007. Local liabilities at December 31, 2008 in Asia Pacific and Latin America were $12.1 billion and $538 million, of which $4.9 billion were in Singapore, $2.2 billion were in Hong
Kong, $1.7 billion were in South Korea, $1.0 billion were in India, and $882 million were in China. There were no other countries with available local liabilities funding local country exposure greater than $500 million.
(7) No country included in Other Asia Pacific, Other Latin America, Other Middle East and Africa, and Central and Eastern Europe had total foreign exposure of more than $500 million.
80
Bank of America 2008