Bank of America 2008 Annual Report Download - page 138
Download and view the complete annual report
Please find page 138 of the 2008 Bank of America annual report below. You can navigate through the pages in the report by either clicking on the pages listed below, or by using the keyword search tool below to find specific information within the annual report.-
 1
1 -
2
-
3
-
4
-
5
-
6
-
7
-
8
-
9
-
10
-
11
-
12
-
13
-
14
-
15
-
16
-
17
-
18
-
19
-
20
-
21
-
22
-
23
-
24
-
25
-
26
-
27
-
28
-
29
-
30
-
31
-
32
-
33
-
34
-
35
-
36
-
37
-
38
-
39
-
40
-
41
-
42
-
43
-
44
-
45
-
46
-
47
-
48
-
49
-
50
-
51
-
52
-
53
-
54
-
55
-
56
-
57
-
58
-
59
-
60
-
61
-
62
-
63
-
64
-
65
-
66
-
67
-
68
-
69
-
70
-
71
-
72
-
73
-
74
-
75
-
76
-
77
-
78
-
79
-
80
-
81
-
82
-
83
-
84
-
85
-
86
-
87
-
88
-
89
-
90
-
91
-
92
-
93
-
94
-
95
-
96
-
97
-
98
-
99
-
100
-
101
-
102
-
103
-
104
-
105
-
106
-
107
-
108
-
109
-
110
-
111
-
112
-
113
-
114
-
115
-
116
-
117
-
118
-
119
-
120
-
121
-
122
-
123
-
124
-
125
-
126
-
127
-
 128
128 -
 129
129 -
 130
130 -
 131
131 -
 132
132 -
 133
133 -
 134
134 -
 135
135 -
 136
136 -
 137
137 -
 138
138 -
 139
139 -
 140
140 -
 141
141 -
 142
142 -
 143
143 -
 144
144 -
 145
145 -
 146
146 -
 147
147 -
 148
148 -
149
-
150
-
151
-
152
-
153
-
154
-
155
-
156
-
157
-
158
-
159
-
160
-
161
-
162
-
163
-
164
-
165
-
166
-
167
-
168
-
169
-
170
-
171
-
172
-
173
-
174
-
175
-
176
-
177
-
178
-
179
-
180
-
181
-
182
-
183
-
184
-
185
-
186
-
187
-
188
-
189
-
190
-
191
-
192
-
193
-
194
-
195
 |
 |

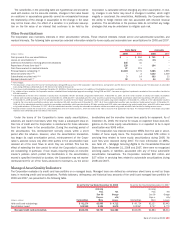
Less than twelve months Twelve months or longer Total
(Dollars in millions) Fair Value
Gross
Unrealized
Losses Fair Value
Gross
Unrealized
Losses Fair Value
Gross
Unrealized
Losses
Available-for-sale debt securities as of December 31, 2008
U.S. Treasury securities and agency debentures
$ 306
$ (14) $ – $ – $ 306 $ (14)
Mortgage-backed securities
22,350
(6,788) 11,649 (2,695) 33,999 (9,483)
Foreign securities
3,491
(562) 1,126 (116) 4,617 (678)
Corporate/Agency bonds
2,573
(934) 666 (88) 3,239 (1,022)
Other taxable securities
12,870
(1,077) 501 (223) 13,371 (1,300)
Total taxable securities
41,590
(9,375) 13,942 (3,122) 55,532 (12,497)
Tax-exempt securities
6,386
(682) 1,540 (299) 7,926 (981)
Total temporarily-impaired available-for-sale debt securities
47,976
(10,057) 15,482 (3,421) 63,458 (13,478)
Temporarily-impaired available-for-sale marketable equity securities
3,431
(499) 1,555 (1,038) 4,986 (1,537)
Total temporarily-impaired available-for-sale securities
$ 51,407
$(10,556) $ 17,037 $ (4,459) $ 68,444 $(15,015)
Available-for-sale debt securities as of December 31, 2007
Mortgage-backed securities
$10,103
$ (438) $140,600 $(2,706) $150,703 $ (3,144)
Foreign securities
357
(88) 2,129 (13) 2,486 (101)
Corporate/Agency bonds
127
(2) 2,181 (74) 2,308 (76)
Other taxable securities
622
(25) 712 (59) 1,334 (84)
Total taxable securities
11,209
(553) 145,622 (2,852) 156,831 (3,405)
Tax-exempt securities
2,563
(66) 505 (3) 3,068 (69)
Total temporarily-impaired available-for-sale debt securities
13,772
(619) 146,127 (2,855) 159,899 (3,474)
Temporarily-impaired available-for-sale marketable equity securities
2,353
(322) 57 (30) 2,410 (352)
Total temporarily-impaired available-for-sale securities
$16,125
$ (941) $146,184 $(2,885) $162,309 $ (3,826)
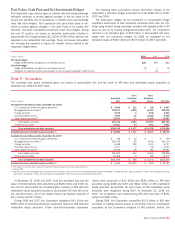
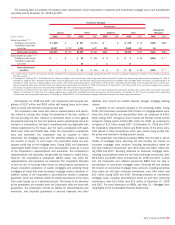
Corporation transferred approximately $1.7 billion of leveraged lending
bonds from trading account assets to AFS debt securities due to the
Corporation’s decision to hold these bonds for the foreseeable future.
The table above presents the current fair value and the associated
gross unrealized losses only on investments in securities with gross
unrealized losses at December 31, 2008 and 2007. The table also dis-
closes whether these securities have had gross unrealized losses for
less than twelve months, or for twelve months or longer.
The impairment of AFS debt and marketable equity securities is based
on a variety of factors, including the length of time and extent to which
the market value has been less than cost, the financial condition of the
issuer of the security, and the Corporation’s intent and ability to hold the
security to recovery.
At December 31, 2008, the amortized cost of approximately 12,000
AFS securities exceeded their fair value by $15.0 billion. Included in the
$15.0 billion of gross unrealized losses on AFS securities at
December 31, 2008, was $10.6 billion of gross unrealized losses that
have existed for less than twelve months and $4.5 billion of gross unreal-
ized losses that have existed for a period of twelve months or longer. Of
the gross unrealized losses existing for twelve months or more, $2.7 bil-
lion, or 60 percent, of the gross unrealized loss is related to approx-
imately 400 mortgage-backed securities primarily due to continued
deterioration in collateralized mortgage obligation values driven by a lack
of market liquidity. In addition, of the gross unrealized losses existing for
twelve months or more, $1.0 billion, or 23 percent, of the gross unreal-
ized loss is related to approximately 300 AFS marketable equity secu-
rities primarily due to the overall decline in the market during 2008. The
Corporation has the ability and intent to hold these securities for a period
of time sufficient to recover all gross unrealized losses.
The Corporation had investments in AFS debt securities from Fannie
Mae, Freddie Mac and Ginnie Mae that exceeded 10 percent of con-
solidated shareholders’ equity as of December 31, 2008. These invest-
ments had market values of $104.1 billion, $46.9 billion and $44.6
billion at December 31, 2008 and total amortized costs of $102.9 billion,
$46.1 billion and $43.7 billion, respectively. The Corporation had invest-
ments in AFS debt securities from Fannie Mae and Freddie Mac that
exceeded 10 percent of consolidated shareholders’ equity as of
December 31, 2007. These investments had market values of $100.8
billion and $43.2 billion at December 31, 2007 and total amortized costs
of $102.9 billion and $43.9 billion. The Corporation’s investments in AFS
debt securities from Ginnie Mae did not exceed 10 percent of con-
solidated shareholders’ equity as of December 31, 2007.
Securities are pledged or assigned to secure borrowed funds, govern-
ment and trust deposits and for other purposes. The carrying value of
pledged securities was $158.9 billion and $107.4 billion at
December 31, 2008 and 2007.
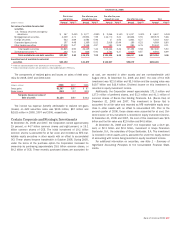
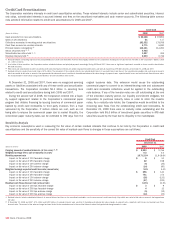
The expected maturity distribution of the Corporation’s mortgage-
backed securities and the contractual maturity distribution of the Corpo-
ration’s other debt securities, and the yields of the Corporation’s AFS
debt securities portfolio at December 31, 2008 are summarized in the
following table. Actual maturities may differ from the contractual or
expected maturities since borrowers may have the right to prepay obliga-
tions with or without prepayment penalties.
136
Bank of America 2008