Bank of America 2008 Annual Report Download - page 80
Download and view the complete annual report
Please find page 80 of the 2008 Bank of America annual report below. You can navigate through the pages in the report by either clicking on the pages listed below, or by using the keyword search tool below to find specific information within the annual report.-
 1
1 -
2
-
3
-
4
-
5
-
6
-
7
-
8
-
9
-
10
-
11
-
12
-
13
-
14
-
15
-
16
-
17
-
18
-
19
-
20
-
21
-
22
-
23
-
24
-
25
-
26
-
27
-
28
-
29
-
30
-
31
-
32
-
33
-
34
-
35
-
36
-
37
-
38
-
39
-
40
-
41
-
42
-
43
-
44
-
45
-
46
-
47
-
48
-
49
-
50
-
51
-
52
-
53
-
54
-
55
-
56
-
57
-
58
-
59
-
60
-
61
-
62
-
63
-
64
-
65
-
66
-
67
-
68
-
69
-
 70
70 -
 71
71 -
 72
72 -
 73
73 -
 74
74 -
 75
75 -
 76
76 -
 77
77 -
 78
78 -
 79
79 -
 80
80 -
 81
81 -
 82
82 -
 83
83 -
 84
84 -
 85
85 -
 86
86 -
 87
87 -
 88
88 -
 89
89 -
 90
90 -
91
-
92
-
93
-
94
-
95
-
96
-
97
-
98
-
99
-
100
-
101
-
102
-
103
-
104
-
105
-
106
-
107
-
108
-
109
-
110
-
111
-
112
-
113
-
114
-
115
-
116
-
117
-
118
-
119
-
120
-
121
-
122
-
123
-
124
-
125
-
126
-
127
-
128
-
129
-
130
-
131
-
132
-
133
-
134
-
135
-
136
-
137
-
138
-
139
-
140
-
141
-
142
-
143
-
144
-
145
-
146
-
147
-
148
-
149
-
150
-
151
-
152
-
153
-
154
-
155
-
156
-
157
-
158
-
159
-
160
-
161
-
162
-
163
-
164
-
165
-
166
-
167
-
168
-
169
-
170
-
171
-
172
-
173
-
174
-
175
-
176
-
177
-
178
-
179
-
180
-
181
-
182
-
183
-
184
-
185
-
186
-
187
-
188
-
189
-
190
-
191
-
192
-
193
-
194
-
195
 |
 |

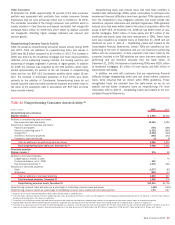
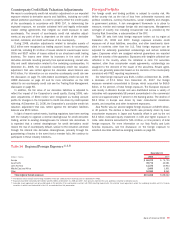
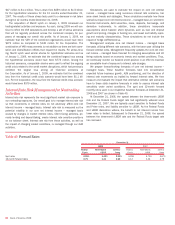
Table 32 Net Credit Default Protection by Credit Exposure Debt Rating (1)
(Dollars in millions) December 31
2008 2007
Ratings
(2)
Net Notional Percent Net Notional Percent
AAA
$30
(0.3)% $ (13) 0.2%
AA
(103)
1.1 (92) 1.3
A
(2,800)
29.0 (2,408) 33.7
BBB
(4,856)
50.2 (3,328) 46.6
BB
(1,948)
20.2 (1,524) 21.3
B
(579)
6.0 (180) 2.5
CCC and below
(278)
2.9 (75) 1.0
NR
(3)
880
(9.1) 474 (6.6)
Total net credit default protection
$(9,654)
100.0% $(7,146) 100.0%
(1) In order to mitigate the cost of purchasing credit protection, credit exposure can be added by selling credit protection. The distribution of debt rating for net notional credit default protection purchased is shown as a
negative and the net notional credit protection sold is shown as a positive amount.
(2) The Corporation considers ratings of BBB- or higher to meet the definition of investment grade.
(3) In addition to names which have not been rated, “NR” includes $948 million and $550 million in net credit default swaps index positions at December 31, 2008 and 2007. While index positions are principally
investment grade, credit default swaps indices include names in and across each of the ratings categories.
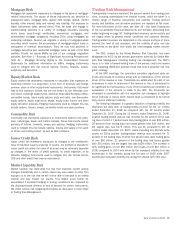
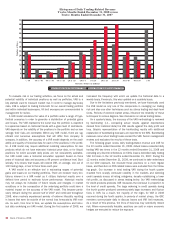
In addition to our net notional credit default protection purchased to
cover the funded and unfunded portion of certain credit exposures, credit
derivatives are used for market-making activities for clients and establish-
ing proprietary positions intended to profit from directional or relative
value changes. We execute the majority of our credit derivative positions
in the over-the-counter market with large, international financial
institutions, including broker/dealers and to a lesser degree with a variety
of other investors. Because these transactions are executed in the
over-the-counter market, we are subject to settlement risk. We are also
subject to credit risk in the event that these counterparties fail to perform
under the terms of these contracts. In most cases, credit derivative
transactions are executed on a daily margin basis. Therefore, events such
as a credit downgrade (depending on the ultimate rating level) or a breach
of credit covenants would typically require an increase in the amount of
collateral required of the counterparty (where applicable), and/or allow us
to take additional protective measures such as early termination of all
trades. Further, we enter into legally enforceable master netting agree-
ments which reduce risk by permitting the closeout and netting of trans-
actions with the same counterparty upon the occurrence of certain
events.
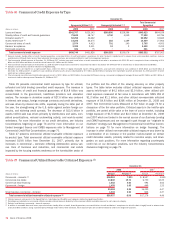
The notional amounts presented in Table 33 represent the total con-
tract/notional amount of credit derivatives outstanding and includes both
purchased and written protection. The credit risk amounts are measured
as the net replacement cost in the event the counterparties with con-
tracts in a gain position to us fail to perform under the terms of those
contracts. We use the current mark-to-market value to represent credit
exposure without giving consideration to future mark-to-market
changes. The credit risk amounts take into consideration the effects of
legally enforceable master netting agreements, and on an aggregate
basis have been reduced by cash collateral applied against derivative
assets. The significant increase in credit spreads across nearly all major
credit indices during 2008 drove the increase in counterparty credit risk
for purchased protection. The $1.0 trillion decrease in the contract/
notional value of credit derivatives was driven by our continued efforts to
reduce aggregate positions to minimize market and operational risk. For
information on the performance risk of our written protection credit
derivatives, see Note 4 – Derivatives to the Consolidated Financial
Statements.
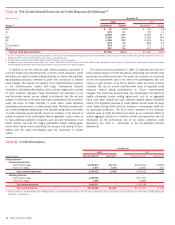
Table 33 Credit Derivatives
December 31
2008 2007
(Dollars in millions) Contract/Notional Credit Risk
(1)
Contract/Notional Credit Risk
(1)
Credit derivatives
Purchased protection:
Credit default swaps
$1,025,876
$11,772 $1,490,641 $6,822
Total return swaps
6,575
1,678 13,551 671
Total purchased protection
1,032,451
13,450 1,504,192 7,493
Written protection:
Credit default swaps
1,000,034
–1,517,305 –
Total return swaps
6,203
–24,884 –
Total written protection
1,006,237
–1,542,189 –
Total credit derivatives
$2,038,688
$13,450 $3,046,381 $7,493
(1) Does not reflect any potential benefit from offsetting exposure to non-credit derivative products with the same counterparties that may be netted upon the occurrence of certain events, thereby reducing the
Corporation’s overall exposure.
78
Bank of America 2008