Bank of America 2008 Annual Report Download - page 69
Download and view the complete annual report
Please find page 69 of the 2008 Bank of America annual report below. You can navigate through the pages in the report by either clicking on the pages listed below, or by using the keyword search tool below to find specific information within the annual report.-
 1
1 -
2
-
3
-
4
-
5
-
6
-
7
-
8
-
9
-
10
-
11
-
12
-
13
-
14
-
15
-
16
-
17
-
18
-
19
-
20
-
21
-
22
-
23
-
24
-
25
-
26
-
27
-
28
-
29
-
30
-
31
-
32
-
33
-
34
-
35
-
36
-
37
-
38
-
39
-
40
-
41
-
42
-
43
-
44
-
45
-
46
-
47
-
48
-
49
-
50
-
51
-
52
-
53
-
54
-
55
-
56
-
57
-
58
-
 59
59 -
 60
60 -
 61
61 -
 62
62 -
 63
63 -
 64
64 -
 65
65 -
 66
66 -
 67
67 -
 68
68 -
 69
69 -
 70
70 -
 71
71 -
 72
72 -
 73
73 -
 74
74 -
 75
75 -
 76
76 -
 77
77 -
 78
78 -
 79
79 -
80
-
81
-
82
-
83
-
84
-
85
-
86
-
87
-
88
-
89
-
90
-
91
-
92
-
93
-
94
-
95
-
96
-
97
-
98
-
99
-
100
-
101
-
102
-
103
-
104
-
105
-
106
-
107
-
108
-
109
-
110
-
111
-
112
-
113
-
114
-
115
-
116
-
117
-
118
-
119
-
120
-
121
-
122
-
123
-
124
-
125
-
126
-
127
-
128
-
129
-
130
-
131
-
132
-
133
-
134
-
135
-
136
-
137
-
138
-
139
-
140
-
141
-
142
-
143
-
144
-
145
-
146
-
147
-
148
-
149
-
150
-
151
-
152
-
153
-
154
-
155
-
156
-
157
-
158
-
159
-
160
-
161
-
162
-
163
-
164
-
165
-
166
-
167
-
168
-
169
-
170
-
171
-
172
-
173
-
174
-
175
-
176
-
177
-
178
-
179
-
180
-
181
-
182
-
183
-
184
-
185
-
186
-
187
-
188
-
189
-
190
-
191
-
192
-
193
-
194
-
195
 |
 |

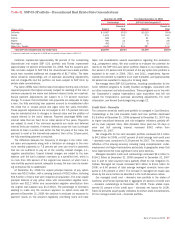
Table 21 SOP 03-3 Portfolio – Discontinued Real Estate State Concentrations
December 31, 2008 Year Ended December 31, 2008
Outstandings SOP 03-3 Net Charge-offs
(1)
(Dollars in millions) Amount
Percent of
Total Amount
Percent of
Total
California $ 9,987 55.2% $1,010 59.4%
Florida 1,831 10.1 275 16.2
Arizona 666 3.7 61 3.6
Virginia 580 3.2 48 2.8
Washington 492 2.7 8 0.5
Other U.S./ Foreign 4,541 25.1 297 17.5
Total SOP 03-3 discontinued real estate loans
$18,097 100.0% $1,699 100.0%
(1) Represents additional net charge-offs for 2008 had the portfolio not been subject to SOP 03-3.
California represented approximately 55 percent of the outstanding
discontinued real estate SOP 03-3 portfolio and Florida represented
approximately 10 percent at December 31, 2008. Had the acquired port-
folio not been subject to SOP 03-3 the discontinued real estate portfolio
would have recorded additional net charge-offs of $1.7 billion. The table
above presents outstandings net of purchase accounting adjustments
and net charge-offs had the portfolio not been subject to SOP 03-3, by
certain state concentrations.
Pay option ARMs have interest rates that adjust monthly and minimum
required payments that adjust annually (subject to resetting of the loan if
minimum payments are made and deferred interest limits are reached).
Annual payment adjustments are subject to a 7.5 percent maximum
change. To ensure that contractual loan payments are adequate to repay
a loan, the fully amortizing loan payment amount is re-established after
the initial five or 10-year period and again every five years thereafter.
These payment adjustments are not subject to the 7.5 percent limit and
may be substantial due to changes in interest rates and the addition of
unpaid interest to the loans’ balance. Payment advantage ARMs have
interest rates that are fixed for an initial period of five years. Payments
are subject to reset if the minimum payments are made and deferred
interest limits are reached. If interest deferrals cause the loan’s principal
balance to reach a certain level within the first 10 years of the loans, the
payment is reset to the interest-only payment; then at the 10-year point,
the fully amortizing payment is required.
The difference between the frequency of changes in the loans’ inter-
est rates and payments along with a limitation on changes in the mini-
mum monthly payments to 7.5 percent per year can result in payments
that are not sufficient to pay all of the monthly interest charges (i.e.,
negative amortization). Unpaid interest charges are added to the loan
balance until the loan’s balance increases to a specified limit, which is
no more than 115 percent of the original loan amount, at which time a
new monthly payment amount adequate to repay the loan over its remain-
ing contractual life is established.
At December 31, 2008 the unpaid principal balance of pay option
loans was $23.2 billion, with a carrying amount of $18.2 billion, including
$16.8 billion of loans that were impaired at acquisition. The total unpaid
principal balance of pay option loans with accumulated negative amor-
tization was $21.2 billion and accumulated negative amortization from
the original loan balance was $1.3 billion. The percentage of borrowers
electing to make only the minimum payment on option arms was 57
percent at December 31, 2008. We continue to evaluate our exposure to
payment resets on the acquired negatively amortizing loans and have
taken into consideration several assumptions regarding this evaluation
(e.g., prepayment rates). We also continue to evaluate the potential for
resets on the SOP 03-3 pay option portfolio. Based on our expectations,
four percent, 31 percent and 20 percent of the pay option loan portfolio is
expected to be reset in 2009, 2010, and 2011, respectively. Approx-
imately nine percent is expected to be reset thereafter, and approximately
36 percent are expected to repay prior to being reset.
We manage these SOP 03-3 portfolios, including consideration for the
home retention programs to modify troubled mortgages, consistent with
our other consumer real estate practices. These programs are in line with
the Corporation’s original expectations upon acquisition and will not
impact the Corporation’s purchase accounting adjustments. For more
information, see Recent Events beginning on page 22.
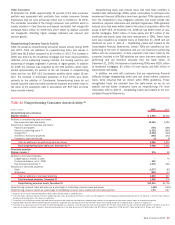
Credit Card – Domestic
The consumer domestic credit card portfolio is managed in Card Services.
Outstandings in the held domestic credit card loan portfolio decreased
$1.6 billion at December 31, 2008 compared to December 31, 2007 due
to higher securitized balances and risk mitigation initiatives partially off-
set by lower payment rates. Held domestic loans past due 90 days or
more and still accruing interest increased $342 million from
December 31, 2007.
Net charge-offs for the held domestic portfolio increased $1.1 billion
to $4.2 billion for 2008, or 6.57 percent of total average held credit card
– domestic loans compared to 5.29 percent for 2007. The increase was
reflective of the slowing economy including rising unemployment, under-
employment and higher bankruptcies particularly in geographic areas that
have experienced the most significant home price declines.
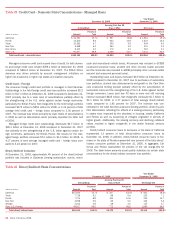
Managed domestic credit card outstandings increased $2.3 billion to
$154.2 billion at December 31, 2008 compared to December 31, 2007
due in part to lower payment rates partially offset by risk mitigation ini-
tiatives. Managed net losses increased $3.1 billion to $10.1 billion for
2008, or 6.60 percent of total average managed domestic loans com-
pared to 4.91 percent in 2007. The increase in managed net losses was
driven by the same factors as described in the held discussion above.
Our managed credit card – domestic loan portfolio in the states of
California and Florida represented in aggregate 24 percent of credit card
– domestic outstandings at December 31, 2008. These states repre-
sented 31 percent of the credit card – domestic net losses for 2008.
Table 22 presents asset quality indicators by certain state concentrations
for the managed credit card – domestic portfolio.
Bank of America 2008
67