Bank of America 2008 Annual Report Download - page 139
Download and view the complete annual report
Please find page 139 of the 2008 Bank of America annual report below. You can navigate through the pages in the report by either clicking on the pages listed below, or by using the keyword search tool below to find specific information within the annual report.-
 1
1 -
2
-
3
-
4
-
5
-
6
-
7
-
8
-
9
-
10
-
11
-
12
-
13
-
14
-
15
-
16
-
17
-
18
-
19
-
20
-
21
-
22
-
23
-
24
-
25
-
26
-
27
-
28
-
29
-
30
-
31
-
32
-
33
-
34
-
35
-
36
-
37
-
38
-
39
-
40
-
41
-
42
-
43
-
44
-
45
-
46
-
47
-
48
-
49
-
50
-
51
-
52
-
53
-
54
-
55
-
56
-
57
-
58
-
59
-
60
-
61
-
62
-
63
-
64
-
65
-
66
-
67
-
68
-
69
-
70
-
71
-
72
-
73
-
74
-
75
-
76
-
77
-
78
-
79
-
80
-
81
-
82
-
83
-
84
-
85
-
86
-
87
-
88
-
89
-
90
-
91
-
92
-
93
-
94
-
95
-
96
-
97
-
98
-
99
-
100
-
101
-
102
-
103
-
104
-
105
-
106
-
107
-
108
-
109
-
110
-
111
-
112
-
113
-
114
-
115
-
116
-
117
-
118
-
119
-
120
-
121
-
122
-
123
-
124
-
125
-
126
-
127
-
128
-
 129
129 -
 130
130 -
 131
131 -
 132
132 -
 133
133 -
 134
134 -
 135
135 -
 136
136 -
 137
137 -
 138
138 -
 139
139 -
 140
140 -
 141
141 -
 142
142 -
 143
143 -
 144
144 -
 145
145 -
 146
146 -
 147
147 -
 148
148 -
 149
149 -
150
-
151
-
152
-
153
-
154
-
155
-
156
-
157
-
158
-
159
-
160
-
161
-
162
-
163
-
164
-
165
-
166
-
167
-
168
-
169
-
170
-
171
-
172
-
173
-
174
-
175
-
176
-
177
-
178
-
179
-
180
-
181
-
182
-
183
-
184
-
185
-
186
-
187
-
188
-
189
-
190
-
191
-
192
-
193
-
194
-
195
 |
 |

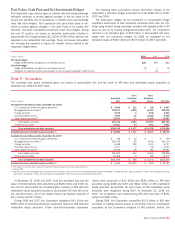
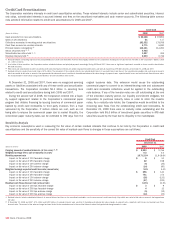
December 31, 2008
Due in one
year or less
Due after one year
through five years
Due after five years
through ten years Due after ten years Total
(Dollars in millions) Amount Yield
(1)
Amount Yield
(1)
Amount Yield
(1)
Amount Yield
(1)
Amount Yield
(1)
Fair value of available-for-sale debt
securities
U.S. Treasury securities and agency
debentures $ 167 2.45% $ 1,077 4.89% $ 2,366 5.14% $ 1,037 5.40% $ 4,647 5.04%
Mortgage-backed securities 3,029 4.71 25,953 7.99 116,770 5.21 83,826 5.55 229,578 5.68
Foreign securities 543 4.89 2,582 5.96 17 4.56 1,861 6.37 5,003 6.02
Corporate/Agency bonds 197 4.48 1,369 5.03 2,818 10.44 185 6.23 4,569 8.65
Other taxable securities 17,909 2.47 5,158 4.87 193 5.09 283 6.76 23,543 3.11
Total taxable securities 21,845 2.90 36,139 7.24 122,164 5.36 87,192 5.58 267,340 5.50
Tax-exempt securities
(2)
142 5.41 836 5.91 1,761 6.37 6,825 6.87 9,564 6.69
Total available-for-sale debt securities
$21,987
2.92 $ 36,975 7.22 $ 123,925 5.38 $94,017 5.68 $276,904 5.55
Amortized cost of available-for-sale debt
securities
$23,150
$ 41,879 $ 125,537 $95,679 $286,245
(1) Yields are calculated based on the amortized cost of the securities.
(2) Yields of tax-exempt securities are calculated on a fully taxable-equivalent (FTE) basis.
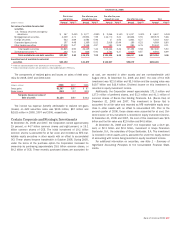
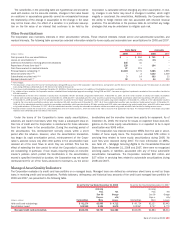
The components of realized gains and losses on sales of debt secu-
rities for 2008, 2007 and 2006 were:
(Dollars in millions) 2008 2007 2006
Gross gains
$1,367
$197 $ 87
Gross losses
(243)
(17) (530)
Net gains (losses) on sales of
debt securities
$1,124
$180 $(443)
The income tax expense (benefit) attributable to realized net gains
(losses) on debt securities sales was $416 million, $67 million and
$(163) million in 2008, 2007 and 2006, respectively.
Certain Corporate and Strategic Investments
At December 31, 2008 and 2007, the Corporation owned approximately
19 percent, or 44.7 billion common shares and eight percent, or 19.1
billion common shares of CCB. The initial investment of 19.1 billion
common shares is accounted for at fair value and recorded as AFS mar-
ketable equity securities in other assets with an offset to accumulated
OCI. These shares became transferable in October 2008. During 2008,
under the terms of the purchase option the Corporation increased its
ownership by purchasing approximately 25.6 billion common shares, or
$9.2 billion of CCB. These recently purchased shares are accounted for
at cost, are recorded in other assets and are non-transferable until
August 2011. At December 31, 2008 and 2007, the cost of the CCB
investment was $12.0 billion and $3.0 billion and the carrying value was
$19.7 billion and $16.4 billion. Dividend income on this investment is
recorded in equity investment income.
Additionally, the Corporation owned approximately 171.3 million and
137.0 million of preferred shares, and 51.3 million and 41.1 million of
common shares of Banco Itaú Holding Financeira S.A. (Banco Itaú) at
December 31, 2008 and 2007. This investment in Banco Itaú is
accounted for at fair value and recorded as AFS marketable equity secu-
rities in other assets with an offset to accumulated OCI. Prior to the
second quarter of 2008, these shares were accounted for at cost. Divi-
dend income on this investment is recorded in equity investment income.
At December 31, 2008 and 2007, the cost of this investment was $2.6
billion and the fair value was $2.5 billion and $4.6 billion.
At December 31, 2008 and 2007, the Corporation had a 24.9 per-
cent, or $2.1 billion and $2.6 billion, investment in Grupo Financiero
Santander, S.A., the subsidiary of Grupo Santander, S.A. This investment
is recorded in other assets and is accounted for under the equity method
of accounting with income being recorded in equity investment income.
For additional information on securities, see Note 1 – Summary of
Significant Accounting Principles to the Consolidated Financial State-
ments.
Bank of America 2008
137