Bank of America 2008 Annual Report Download - page 75
Download and view the complete annual report
Please find page 75 of the 2008 Bank of America annual report below. You can navigate through the pages in the report by either clicking on the pages listed below, or by using the keyword search tool below to find specific information within the annual report.-
 1
1 -
2
-
3
-
4
-
5
-
6
-
7
-
8
-
9
-
10
-
11
-
12
-
13
-
14
-
15
-
16
-
17
-
18
-
19
-
20
-
21
-
22
-
23
-
24
-
25
-
26
-
27
-
28
-
29
-
30
-
31
-
32
-
33
-
34
-
35
-
36
-
37
-
38
-
39
-
40
-
41
-
42
-
43
-
44
-
45
-
46
-
47
-
48
-
49
-
50
-
51
-
52
-
53
-
54
-
55
-
56
-
57
-
58
-
59
-
60
-
61
-
62
-
63
-
64
-
 65
65 -
 66
66 -
 67
67 -
 68
68 -
 69
69 -
 70
70 -
 71
71 -
 72
72 -
 73
73 -
 74
74 -
 75
75 -
 76
76 -
 77
77 -
 78
78 -
 79
79 -
 80
80 -
 81
81 -
 82
82 -
 83
83 -
 84
84 -
 85
85 -
86
-
87
-
88
-
89
-
90
-
91
-
92
-
93
-
94
-
95
-
96
-
97
-
98
-
99
-
100
-
101
-
102
-
103
-
104
-
105
-
106
-
107
-
108
-
109
-
110
-
111
-
112
-
113
-
114
-
115
-
116
-
117
-
118
-
119
-
120
-
121
-
122
-
123
-
124
-
125
-
126
-
127
-
128
-
129
-
130
-
131
-
132
-
133
-
134
-
135
-
136
-
137
-
138
-
139
-
140
-
141
-
142
-
143
-
144
-
145
-
146
-
147
-
148
-
149
-
150
-
151
-
152
-
153
-
154
-
155
-
156
-
157
-
158
-
159
-
160
-
161
-
162
-
163
-
164
-
165
-
166
-
167
-
168
-
169
-
170
-
171
-
172
-
173
-
174
-
175
-
176
-
177
-
178
-
179
-
180
-
181
-
182
-
183
-
184
-
185
-
186
-
187
-
188
-
189
-
190
-
191
-
192
-
193
-
194
-
195
 |
 |

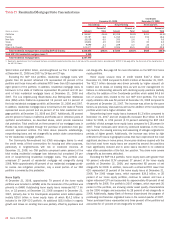
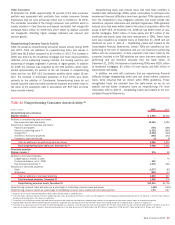
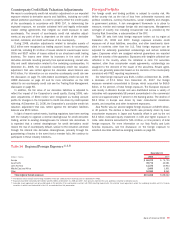
Commercial – Domestic
At December 31, 2008, approximately 92 percent of the commercial –
domestic portfolio, excluding small business, was included in GCIB, pri-
marily in Business Lending (business banking, middle-market and large
multinational corporate loans and leases) and CMAS (acquisition, bridge
financing and institutional investor services). The remaining eight percent
was mostly in GWIM (business-purpose loans for wealthy individuals).
Outstanding commercial – domestic loans increased $11.1 billion to
$200.1 billion at December 31, 2008 compared to 2007 driven primarily
by Business Lending and GWIM partially offset by CMAS due to the sale
of the equity prime brokerage business. Nonperforming commercial –
domestic loans increased by $1.2 billion to $2.0 billion. Net charge-offs
were up $392 million from 2007. These increases were broad-based in
terms of borrowers and industries and were up from very low loss levels
in 2007. Utilized reservable criticized commercial – domestic exposure,
increased $10.4 billion to $19.0 billion primarily driven by deterioration
across various portfolios within GCIB. Additionally, commercial – domestic
drove the increase in other utilized non-reservable criticized exposure,
primarily mark-to-market derivative assets.
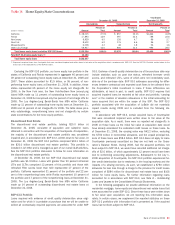
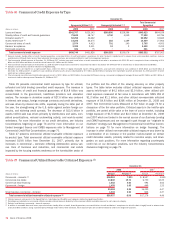
Commercial Real Estate
The commercial real estate portfolio is mostly managed in Business
Lending and consists of loans issued primarily to public and private
developers, homebuilders and commercial real estate firms. Outstanding
loans and leases increased $3.4 billion to $64.7 billion at December 31,
2008 compared to 2007. The increase was primarily driven by growth in
the California, Southwest and Southeast regions. The portfolio remains
diversified across property types with the largest increases in multiple
use, office buildings, hotels/motels and shopping centers/retail. At
December 31, 2008, we had committed homebuilder-related exposure of
$15.7 billion of which $11.0 billion were funded loans, primarily con-
struction and land development, most of which was collateralized.
Non-homebuilder construction and land development comprised $22.1
billion or 34 percent of the commercial real estate loans outstanding at
December 31, 2008.
Nonperforming commercial real estate loans increased $2.8 billion to
$3.9 billion and utilized reservable criticized exposure increased $7.1 bil-
lion to $13.8 billion attributable to the continuing impact of the housing
slowdown on the homebuilder sector, most of which is included in resi-
dential in Table 28, and on other property types, particularly shopping
centers/retail and land and land development. Nonperforming assets and
utilized reservable criticized exposure in the homebuilder sector were
$3.0 billion and $7.6 billion, respectively, at December 31, 2008 com-
pared to $829 million and $5.4 billion at December 31, 2007. Non-
performing assets and utilized reservable criticized exposure for the
non-homebuilder construction and land development sector increased to
$786 million and $3.2 billion. The nonperforming assets ratio and the
utilized criticized ratio for the homebuilder sector was 27.07 percent and
66.33 percent at December 31, 2008 compared to 6.11 percent and
39.31 percent at December 31, 2007. Net charge-offs were up $840
million from 2007 principally related to the homebuilder sector of the
portfolio. Assets held-for-sale associated with commercial real estate
decreased approximately $7.0 billion to $6.9 billion at December 31,
2008 compared to 2007, driven by distributions and sales, completed
securitizations and writedowns.
Table 28 presents outstanding commercial real estate loans by geo-
graphic region and property type.
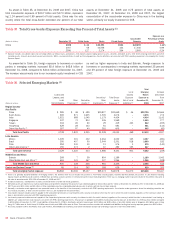
Table 28 Outstanding Commercial Real Estate Loans (1)
December 31
(Dollars in millions) 2008 2007
By Geographic Region (2)
California
$11,270
$ 9,683
Northeast
9,747
8,978
Midwest
7,447
8,005
Southeast
7,365
6,490
Southwest
6,698
5,610
Illinois
5,451
6,835
Florida
5,146
4,908
Midsouth
3,475
2,912
Northwest
3,022
2,644
Other
(3)
1,741
2,190
Geographically diversified
(4)
2,563
2,282
Non-U.S.
979
1,065
Total outstanding commercial real estate loans (5)
$64,904
$61,602
By Property Type
Office buildings
$10,388
$ 8,745
Shopping centers/retail
9,293
8,440
Residential
8,534
10,478
Apartments
8,177
7,615
Land and land development
6,309
6,286
Industrial/warehouse
6,070
5,419
Multiple use
3,444
1,689
Hotels/motels
2,513
1,535
Other
(6)
10,176
11,395
Total outstanding commercial real estate loans (5)
$64,904
$61,602
(1) Primarily includes commercial loans and leases secured by non owner-occupied real estate which are dependent on the sale or lease of the real estate as the primary source of repayment.
(2) Distribution is based on geographic location of collateral. Geographic regions are in the U.S. unless otherwise noted.
(3) Primarily includes properties in the states of Colorado, Utah, Hawaii, Wyoming and Montana which are not defined by other property regions presented.
(4) The geographically diversified category is comprised primarily of unsecured outstandings to real estate investment trusts and national home builders whose portfolios of properties span multiple geographic regions.
(5) Includes commercial real estate loans measured at fair value in accordance with SFAS 159 of $203 million and $304 million at December 31, 2008 and 2007.
(6) Represents loans to borrowers whose primary business is commercial real estate, but the exposure is not secured by the listed property types or is unsecured.
Bank of America 2008
73