Bank of America 2008 Annual Report Download - page 79
Download and view the complete annual report
Please find page 79 of the 2008 Bank of America annual report below. You can navigate through the pages in the report by either clicking on the pages listed below, or by using the keyword search tool below to find specific information within the annual report.-
 1
1 -
2
-
3
-
4
-
5
-
6
-
7
-
8
-
9
-
10
-
11
-
12
-
13
-
14
-
15
-
16
-
17
-
18
-
19
-
20
-
21
-
22
-
23
-
24
-
25
-
26
-
27
-
28
-
29
-
30
-
31
-
32
-
33
-
34
-
35
-
36
-
37
-
38
-
39
-
40
-
41
-
42
-
43
-
44
-
45
-
46
-
47
-
48
-
49
-
50
-
51
-
52
-
53
-
54
-
55
-
56
-
57
-
58
-
59
-
60
-
61
-
62
-
63
-
64
-
65
-
66
-
67
-
68
-
 69
69 -
 70
70 -
 71
71 -
 72
72 -
 73
73 -
 74
74 -
 75
75 -
 76
76 -
 77
77 -
 78
78 -
 79
79 -
 80
80 -
 81
81 -
 82
82 -
 83
83 -
 84
84 -
 85
85 -
 86
86 -
 87
87 -
 88
88 -
 89
89 -
90
-
91
-
92
-
93
-
94
-
95
-
96
-
97
-
98
-
99
-
100
-
101
-
102
-
103
-
104
-
105
-
106
-
107
-
108
-
109
-
110
-
111
-
112
-
113
-
114
-
115
-
116
-
117
-
118
-
119
-
120
-
121
-
122
-
123
-
124
-
125
-
126
-
127
-
128
-
129
-
130
-
131
-
132
-
133
-
134
-
135
-
136
-
137
-
138
-
139
-
140
-
141
-
142
-
143
-
144
-
145
-
146
-
147
-
148
-
149
-
150
-
151
-
152
-
153
-
154
-
155
-
156
-
157
-
158
-
159
-
160
-
161
-
162
-
163
-
164
-
165
-
166
-
167
-
168
-
169
-
170
-
171
-
172
-
173
-
174
-
175
-
176
-
177
-
178
-
179
-
180
-
181
-
182
-
183
-
184
-
185
-
186
-
187
-
188
-
189
-
190
-
191
-
192
-
193
-
194
-
195
 |
 |

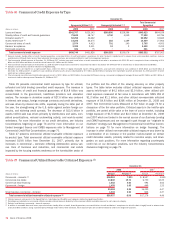
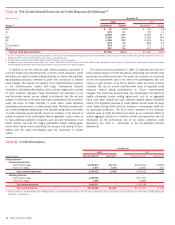
Table 30 Commercial Credit Exposure by Industry (1, 2)
December 31
Commercial Utilized Total Commercial Committed
(Dollars in millions) 2008 2007 2008 2007
Real estate
(3)
$ 79,766
$ 81,260
$103,889
$111,742
Diversified financials
50,327
37,872
103,306
86,118
Government and public education
39,386
31,743
58,608
57,437
Capital goods
27,588
25,908
52,522
52,356
Retailing
30,736
32,401
50,102
54,037
Healthcare equipment and services
31,280
24,337
46,785
40,962
Consumer services
28,715
23,382
43,948
38,650
Materials
22,825
22,176
38,105
38,717
Commercial services and supplies
24,095
21,175
34,867
31,858
Individuals and trusts
22,752
22,323
33,045
32,425
Food, beverage and tobacco
17,257
13,919
28,521
25,701
Banks
22,134
21,261
26,493
35,323
Energy
11,885
12,772
22,732
23,510
Media
8,939
7,901
19,301
19,343
Utilities
8,230
6,438
19,272
19,281
Transportation
13,050
12,803
18,561
18,824
Insurance
11,223
7,162
17,855
16,014
Religious and social organizations
9,539
8,208
12,576
10,982
Consumer durables and apparel
6,219
5,802
10,862
10,907
Technology hardware and equipment
3,971
4,615
10,371
10,239
Pharmaceuticals and biotechnology
3,721
4,349
10,111
8,563
Software and services
4,093
4,739
9,590
10,128
Telecommunication services
3,681
3,475
8,036
8,235
Food and staples retailing
4,282
3,611
7,012
6,465
Automobiles and components
3,093
2,648
6,081
6,960
Household and personal products
1,137
889
2,817
2,776
Semiconductors and semiconductor equipment
1,105
1,140
1,822
1,734
Other
7,720
7,617
8,142
7,715
Total commercial credit exposure by industry
$498,749
$451,926
$805,332
$787,002
Net credit default protection purchased on total commitments
(4)
$ (9,654)
$ (7,146)
(1) Total commercial utilized and total commercial committed exposure includes loans and letters of credit measured at fair value in accordance with SFAS 159 and are comprised of loans outstanding of $5.4 billion and
$4.6 billion and issued letters of credit at notional value of $1.4 billion and $1.1 billion at December 31, 2008 and 2007. In addition, total commercial committed exposure includes unfunded loan commitments at
notional value of $15.5 billion and $19.8 billion at December 31, 2008 and 2007.
(2) Includes small business commercial – domestic exposure.
(3) Industries are viewed from a variety of perspectives to best isolate the perceived risks. For purposes of this table, the real estate industry is defined based upon the borrowers’ or counterparties’ primary business
activity using operating cash flow and primary source of repayment as key factors.
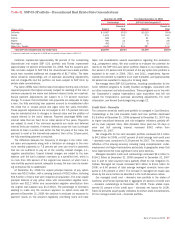
(4) Represents net notional credit protection purchased.
Credit protection is purchased to cover the funded portion as well as
the unfunded portion of certain credit exposure. To lessen the cost of
obtaining our desired credit protection levels, credit exposure may be
added within an industry, borrower or counterparty group by selling pro-
tection.
At December 31, 2008 and 2007, we had net notional credit default
protection purchased in our credit derivatives portfolio to cover the funded
and unfunded portion of certain credit exposures of $9.7 billion and $7.1
billion. The mark-to-market impacts, including the cost of net credit
default protection, hedging our exposure, resulted in net gains of $993
million in 2008 compared to net gains of $160 million in 2007. The
average VAR for these credit derivative hedges was $24 million and $18
million for 2008 and 2007. The increase in VAR was driven by an
increase in the average amount of credit protection outstanding during
the year. There is a diversification effect between the net credit default
protection hedging our credit exposure and the related credit exposure
such that their combined average VAR was $22 million for 2008. Refer to
the Trading Risk Management discussion beginning on page 85 for a
description of our VAR calculation for the market-based trading portfolio.
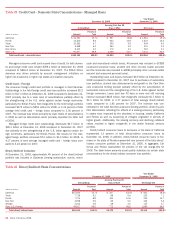
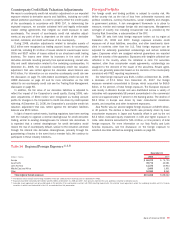
Tables 31 and 32 present the maturity profiles and the credit
exposure debt ratings of the net credit default protection portfolio at
December 31, 2008 and 2007.
Table 31 Net Credit Default Protection by Maturity Profile (1)
December 31
2008 2007
Less than or equal to one year
1%
2%
Greater than one year and less than or equal to five years
92
67
Greater than five years
7
31
Total net credit default protection
100%
100%
(1) In order to mitigate the cost of purchasing credit protection, credit exposure can be added by selling credit protection. The distribution of maturities for net credit default protection purchased is shown as positive
percentages and the distribution of maturities for net credit protection sold as negative percentages.
Bank of America 2008
77