Bank of America 2008 Annual Report Download - page 81
Download and view the complete annual report
Please find page 81 of the 2008 Bank of America annual report below. You can navigate through the pages in the report by either clicking on the pages listed below, or by using the keyword search tool below to find specific information within the annual report.-
 1
1 -
2
-
3
-
4
-
5
-
6
-
7
-
8
-
9
-
10
-
11
-
12
-
13
-
14
-
15
-
16
-
17
-
18
-
19
-
20
-
21
-
22
-
23
-
24
-
25
-
26
-
27
-
28
-
29
-
30
-
31
-
32
-
33
-
34
-
35
-
36
-
37
-
38
-
39
-
40
-
41
-
42
-
43
-
44
-
45
-
46
-
47
-
48
-
49
-
50
-
51
-
52
-
53
-
54
-
55
-
56
-
57
-
58
-
59
-
60
-
61
-
62
-
63
-
64
-
65
-
66
-
67
-
68
-
69
-
70
-
 71
71 -
 72
72 -
 73
73 -
 74
74 -
 75
75 -
 76
76 -
 77
77 -
 78
78 -
 79
79 -
 80
80 -
 81
81 -
 82
82 -
 83
83 -
 84
84 -
 85
85 -
 86
86 -
 87
87 -
 88
88 -
 89
89 -
 90
90 -
 91
91 -
92
-
93
-
94
-
95
-
96
-
97
-
98
-
99
-
100
-
101
-
102
-
103
-
104
-
105
-
106
-
107
-
108
-
109
-
110
-
111
-
112
-
113
-
114
-
115
-
116
-
117
-
118
-
119
-
120
-
121
-
122
-
123
-
124
-
125
-
126
-
127
-
128
-
129
-
130
-
131
-
132
-
133
-
134
-
135
-
136
-
137
-
138
-
139
-
140
-
141
-
142
-
143
-
144
-
145
-
146
-
147
-
148
-
149
-
150
-
151
-
152
-
153
-
154
-
155
-
156
-
157
-
158
-
159
-
160
-
161
-
162
-
163
-
164
-
165
-
166
-
167
-
168
-
169
-
170
-
171
-
172
-
173
-
174
-
175
-
176
-
177
-
178
-
179
-
180
-
181
-
182
-
183
-
184
-
185
-
186
-
187
-
188
-
189
-
190
-
191
-
192
-
193
-
194
-
195
 |
 |

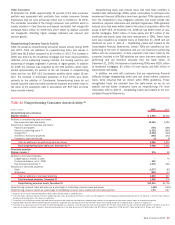
Counterparty Credit Risk Valuation Adjustments
We record a counterparty credit risk valuation adjustment on our expected
exposure related to derivative assets and liabilities, including our credit
default protection purchased, in order to properly reflect the credit quality
of the counterparty in accordance with SFAS 157. In determining the
expected exposure, we consider collateral held and legally enforceable
master netting agreements that mitigate our credit exposure to each
counterparty. The amount of counterparty credit risk valuation adjust-
ments at any point of time is dependent on the value of the derivative
contract, collateral, and credit worthiness of the counterparty.
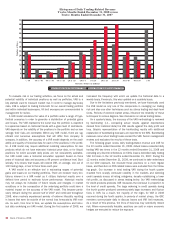
During 2008, valuation adjustments related to derivative assets of
$3.2 billion were recognized as trading account losses for counterparty
credit risk, including $1.1 billion of losses related to insured super senior
CDOs and $537 million of losses related to our structured credit trading
business. The losses were driven by increases in the value of the
derivative contracts resulting primarily from spread widening, market vola-
tility and credit deterioration related to the underlying counterparties. At
December 31, 2008, the cumulative counterparty credit risk valuation
adjustment that was netted against the derivative asset balance was
$4.0 billion. For information on our monoline counterparty credit risk see
the discussion on page 76, CDO-related counterparty credit risk see the
CMAS discussion on page 40 and for more information on the VAR
related to our counterparty credit risk see the Trading Risk Management
discussion on page 85.
In addition, the fair value of our derivative liabilities is adjusted to
reflect the impact of the Corporation’s credit quality. During 2008, valu-
ation adjustments of $364 million were recognized as trading account
profits for changes in the Corporation’s credit risk driven by credit spread
widening. At December 31, 2008, the Corporation’s cumulative credit risk
valuation adjustment that was netted against the derivative liabilities
balance was $573 million.
In light of recent market events, banking regulators have been working
with the industry to organize a central clearinghouse for credit derivative
trading, similar to existing clearinghouses for interest rate derivatives. It
is expected that a central clearinghouse for credit derivatives would
reduce the risk of counterparty default, similar to the reduction achieved
through the interest rate derivative clearinghouse, primarily through the
guaranteeing of trades in the event that a member fails. We continue to
participate in these industry initiatives.
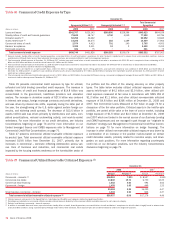
Foreign Portfolio
Our foreign credit and trading portfolio is subject to country risk. We
define country risk as the risk of loss from unfavorable economic and
political conditions, currency fluctuations, social instability and changes
in government policies. A risk management framework is in place to
measure, monitor and manage foreign risk and exposures. Management
oversight of country risk including cross-border risk is provided by the
Country Risk Committee, a subcommittee of the CRC.
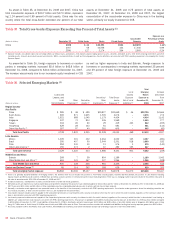
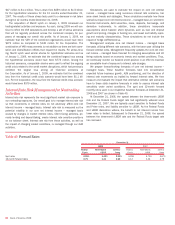
Table 34 sets forth total foreign exposure broken out by region at
December 31, 2008 and 2007. Foreign exposure includes credit
exposure net of local liabilities, securities, and other investments domi-
ciled in countries other than the U.S. Total foreign exposure can be
adjusted for externally guaranteed outstandings and certain collateral
types. Exposures which are assigned external guarantees are reported
under the country of the guarantor. Exposures with tangible collateral are
reflected in the country where the collateral is held. For securities
received, other than cross-border resale agreements, outstandings are
assigned to the domicile of the issuer of the securities. Resale agree-
ments are generally presented based on the domicile of the counterparty
consistent with FFIEC reporting requirements.
Our total foreign exposure was $131.1 billion at December 31, 2008,
a decrease of $7.0 billion from December 31, 2007. Our foreign
exposure remained concentrated in Europe, which accounted for $66.5
billion, or 51 percent, of total foreign exposure. The European exposure
was mostly in Western Europe and was distributed across a variety of
industries with approximately 58 percent concentrated in the commercial
sector and approximately 17 percent in the banking sector. The decline of
$8.3 billion in Europe was driven by lower cross-border derivatives
assets, and securities and other investment exposures.
Asia Pacific was our second largest foreign exposure at $39.8 billion,
or 30 percent. The decline in Asia Pacific was primarily driven by lower
cross-border exposures in Japan and Australia offset in part by the net
$3.3 billion increased equity investment in CCB and higher exposure in
India. Latin America accounted for $11.4 billion, or nine percent, of total
foreign exposure. For more information on our Asia Pacific and Latin
America exposures, see the discussion on the foreign exposure to
selected countries defined as emerging markets on page 80.
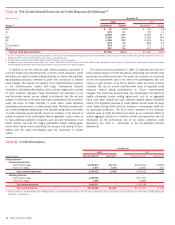
Table 34 Regional Foreign Exposure (1, 2, 3)
December 31
(Dollars in millions) 2008 2007
Europe
$ 66,472
$ 74,725
Asia Pacific
39,774
42,081
Latin America
11,378
10,944
Middle East and Africa
2,456
1,951
Other
10,988
8,361
Total regional foreign exposure
$131,068
$138,062
(1) The balances above exclude local funding or liabilities which are subtracted from local exposures as allowed by the FFIEC.
(2) Exposures have been reduced by $19.6 billion and $6.3 billion at December 31, 2008 and 2007. Such amounts represent the cash applied as collateral to derivative assets.
(3) Generally, resale agreements are presented based on the domicile of the counterparty consistent with FFIEC reporting requirements. Cross-border resale agreements where the underlying securities are U.S. Treasury
securities, in which case the domicile is the U.S., are excluded from this presentation.
Bank of America 2008
79