Bank of America 2008 Annual Report Download - page 87
Download and view the complete annual report
Please find page 87 of the 2008 Bank of America annual report below. You can navigate through the pages in the report by either clicking on the pages listed below, or by using the keyword search tool below to find specific information within the annual report.-
 1
1 -
2
-
3
-
4
-
5
-
6
-
7
-
8
-
9
-
10
-
11
-
12
-
13
-
14
-
15
-
16
-
17
-
18
-
19
-
20
-
21
-
22
-
23
-
24
-
25
-
26
-
27
-
28
-
29
-
30
-
31
-
32
-
33
-
34
-
35
-
36
-
37
-
38
-
39
-
40
-
41
-
42
-
43
-
44
-
45
-
46
-
47
-
48
-
49
-
50
-
51
-
52
-
53
-
54
-
55
-
56
-
57
-
58
-
59
-
60
-
61
-
62
-
63
-
64
-
65
-
66
-
67
-
68
-
69
-
70
-
71
-
72
-
73
-
74
-
75
-
76
-
 77
77 -
 78
78 -
 79
79 -
 80
80 -
 81
81 -
 82
82 -
 83
83 -
 84
84 -
 85
85 -
 86
86 -
 87
87 -
 88
88 -
 89
89 -
 90
90 -
 91
91 -
 92
92 -
 93
93 -
 94
94 -
 95
95 -
 96
96 -
 97
97 -
98
-
99
-
100
-
101
-
102
-
103
-
104
-
105
-
106
-
107
-
108
-
109
-
110
-
111
-
112
-
113
-
114
-
115
-
116
-
117
-
118
-
119
-
120
-
121
-
122
-
123
-
124
-
125
-
126
-
127
-
128
-
129
-
130
-
131
-
132
-
133
-
134
-
135
-
136
-
137
-
138
-
139
-
140
-
141
-
142
-
143
-
144
-
145
-
146
-
147
-
148
-
149
-
150
-
151
-
152
-
153
-
154
-
155
-
156
-
157
-
158
-
159
-
160
-
161
-
162
-
163
-
164
-
165
-
166
-
167
-
168
-
169
-
170
-
171
-
172
-
173
-
174
-
175
-
176
-
177
-
178
-
179
-
180
-
181
-
182
-
183
-
184
-
185
-
186
-
187
-
188
-
189
-
190
-
191
-
192
-
193
-
194
-
195
 |
 |
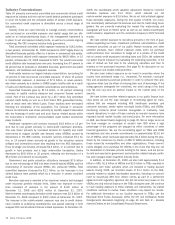
Mortgage Risk
Mortgage risk represents exposures to changes in the value of mortgage-
related instruments. The values of these instruments are sensitive to
prepayment rates, mortgage rates, agency debt ratings, default, market
liquidity, other interest rates and interest rate volatility. Our exposure to
these instruments takes several forms. First, we trade and engage in
market-making activities in a variety of mortgage securities including
whole loans, pass-through certificates, commercial mortgages, and
collateralized mortgage obligations including CDOs using mortgages as
underlying collateral. Second, we originate a variety of mortgage-backed
securities which involves the accumulation of mortgage-related loans in
anticipation of eventual securitization. Third, we may hold positions in
mortgage securities and residential mortgage loans as part of the ALM
portfolio. Fourth, we create MSRs as part of our mortgage origination
activities. See Note 1 – Summary of Significant Accounting Principles and
Note 21 – Mortgage Servicing Rights to the Consolidated Financial
Statements for additional information on MSRs. Hedging instruments
used to mitigate this risk include options, futures, forwards, swaps,
swaptions and securities.
Equity Market Risk
Equity market risk represents exposures to securities that represent an
ownership interest in a corporation in the form of domestic and foreign
common stock or other equity-linked instruments. Instruments that would
lead to this exposure include, but are not limited to, the following: com-
mon stock, exchange traded funds, American Depositary Receipts (ADRs),
convertible bonds, listed equity options (puts and calls), over-the-counter
equity options, equity total return swaps, equity index futures and other
equity derivative products. Hedging instruments used to mitigate this risk
include options, futures, swaps, convertible bonds and cash positions.
Commodity Risk
Commodity risk represents exposures to instruments traded in the petro-
leum, natural gas, power, and metals markets. These instruments consist
primarily of futures, forwards, swaps and options. Hedging instruments
used to mitigate this risk include options, futures and swaps in the same
or similar commodity product, as well as cash positions.
Issuer Credit Risk
Issuer credit risk represents exposures to changes in the creditworthi-
ness of individual issuers or groups of issuers. Our portfolio is exposed to
issuer credit risk where the value of an asset may be adversely impacted
by changes in the levels of credit spreads, by credit migration, or by
defaults. Hedging instruments used to mitigate this risk include bonds,
CDS and other credit fixed income instruments.
Market Liquidity Risk
Market liquidity risk represents the risk that expected market activity
changes dramatically and in certain cases may even cease to exist. This
exposes us to the risk that we will not be able to transact in an orderly
manner and may impact our results. This impact could further be
exacerbated if expected hedging or pricing correlations are impacted by
the disproportionate demand or lack of demand for certain instruments.
We utilize various risk mitigating techniques as discussed in more detail
in Trading Risk Management.
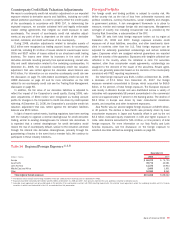
Trading Risk Management
Trading-related revenues represent the amount earned from trading posi-
tions, including market-based net interest income, which are taken in a
diverse range of financial instruments and markets. Trading account
assets and liabilities and derivative positions are reported at fair value.
For more information on fair value, see Note 19 – Fair Value Disclosures
to the Consolidated Financial Statements and Complex Accounting Esti-
mates beginning on page 93. Trading-related revenues can be volatile and
are largely driven by general market conditions and customer demand.
Trading-related revenues are dependent on the volume and type of trans-
actions, the level of risk assumed, and the volatility of price and rate
movements at any given time within the ever-changing market environ-
ment.
The GRC, chaired by the Global Markets Risk Executive, has been
designated by ALCO as the primary governance authority for Global Mar-
kets Risk Management including trading risk management. The GRC’s
focus is to take a forward-looking view of the primary credit and market
risks impacting CMAS and prioritize those that need a proactive risk miti-
gation strategy.
At the GRC meetings, the committee considers significant daily rev-
enues and losses by business along with an explanation of the primary
driver of the revenue or loss. Thresholds are established for each of our
businesses in order to determine if the revenue or loss is considered to
be significant for that business. If any of the thresholds are exceeded, an
explanation of the variance is made to the GRC. The thresholds are
developed in coordination with the respective risk managers to highlight
those revenues or losses which exceed what is considered to be normal
daily income statement volatility.
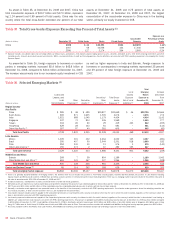
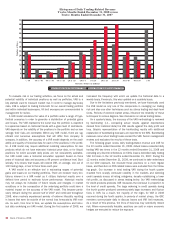
The following histogram is a graphic depiction of trading volatility and
illustrates the daily level of trading-related revenue for the 12 months
ended December 31, 2008 as compared with the 12 months ended
December 31, 2007. During the 12 months ended December 31, 2008,
positive trading-related revenue was recorded for 66 percent of the trad-
ing days of which 17 percent were daily trading gains of over $50 million,
25 percent of the trading days had losses greater than $10 million, and
the largest loss was $173 million. This can be compared to the 12
months ended December 31, 2007, where excluding any discrete write-
downs on CDOs positive trading-related revenue was recorded for 71
percent of the trading days of which five percent were daily trading gains
of over $50 million, 21 percent of the trading days had losses greater
than $10 million, and the largest loss was $159 million. The increase in
daily trading gains of over $50 million and losses of over $10 million in
2008 compared to 2007 was driven by the increased volatility that was
experienced in the markets during the full year of 2008 while 2007
experienced increased volatility only during the second half of the year.
Bank of America 2008
85